

- Binance Coin (BNB) price is traded to lows of $204 after breaking below $210 and $208.
- Declines for BNB come amid strong headwinds around Binance.
- BNB could drop to lows of $180 nad lower if bulls give up $200 zone.
BNB price has broken below a key level as regulatory headwinds and latest issues around payments partners add to the broader downside pressure around the native Binance coin.
According to data from CoinGecko, BNB traded to lows of $204 on Tuesday, with price down nearly 2% in the past 24 hours as of writing. Binance’s native coin has declined more than 14% in the past week. At current levels BNB is trading below a key technical support line and weakness could see bears push for the crucial $200 area.
The last time BNB decisively broke below the zone was in June 2022 after the Terra and Three Arrows Capital collapse. Prices wicked to lows of $183 then.
Why is BNB price down today?
Binance has faced multiple regulatory hurdles over the past several months. Among them is a lawsuit by the US Securities and Exchange Commission (SEC), which sued the crypto exchange in June. BNB price fell sharply at the time, dropping from highs of $306 to lows of $230.
The cryptocurrency has struggled since, with the latest developments likely to have contributed to the downward pressure being reports that the support for euro deposits and withdrawals had been halted.
Notably, Binances EUR payments partner Paysafe announced in June that it would be halting support for the company.
As reported here, Binance has also recently suffered a setback after digital payments platform Checkout.com ended its relationship with the crypto exchange.
Binance Coin price outlook
The confluence of Binance-related issues and the weakness across risk asset markets sees BNB price face potential dip to lowest level in more than a year. This scenario is strengthened by the technical outlook for BNB/USD as seen on the weekly chart.
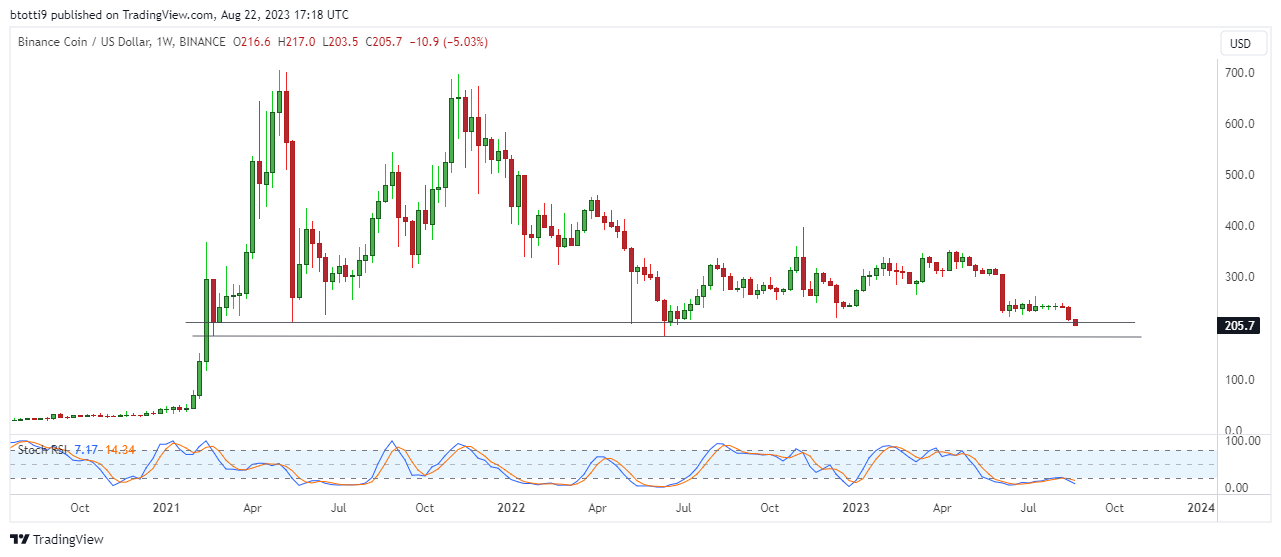 BNB price on the weekly chart. Source: TradingView
On the 4-hour chart below, the RSI and MACD indicators suggest bearish strength as is the exponential moving average and funding rate. Erroneous
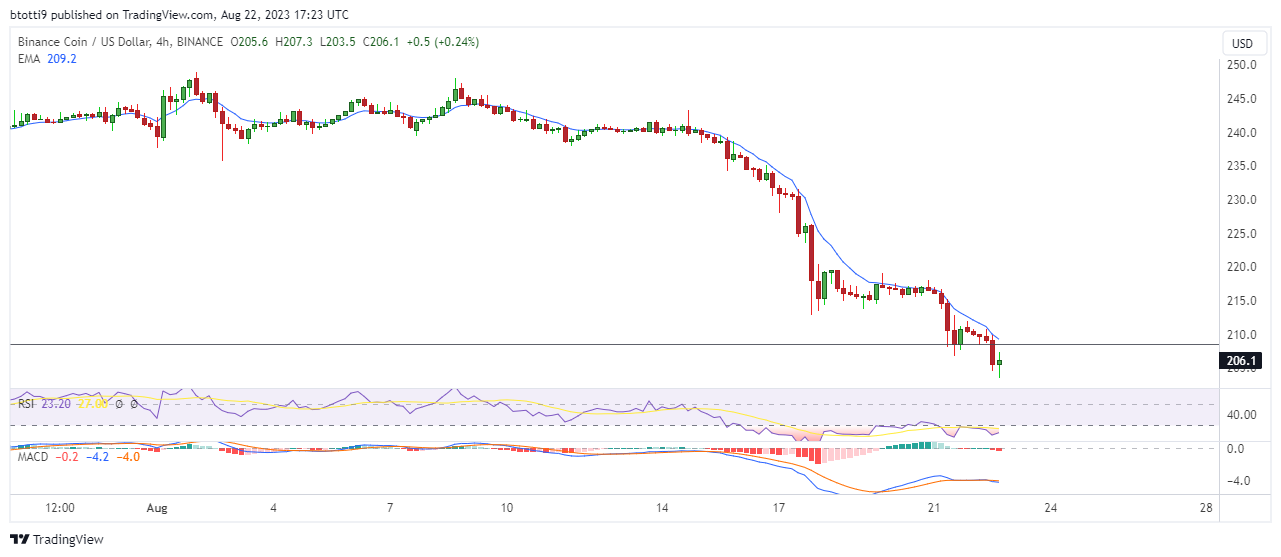
BNB price on the 4-hour chart. Source: TradingView
In BNB’s case, the path of least resistance appears to be downward and key to this is the $200 level. Break this and bears could have easy targets towards the $180 area.
However, should price action push prices higher, reclaiming $210 will be critical to pulling bulls back to the $220-$250 region.