

- Bitcoin moves in a tight correlation with the US dollar
- Investors are unsure what to make of the Fed’s decision
- Technical analysis favors a stronger dollar
The Federal Reserve of the United States (Fed) has raised the funds rate once more this week – this time, by 25bp. The decision triggered a selloff in the US dollar, which lost ground against its peer fiat currencies.
Also, it lost ground against Bitcoin as well.
The reason for the greenback’s weakness was the message that disinflation in the United States had already begun. As such, the fight against rising inflation appears to be over, and so the Fed approaches the terminal rate for this tightening cycle.
But the dollar’s weakness proved to be shortlived.
The next day following the Fed’s decision, the dollar strengthened. Nothing changed from the Fed’s point of view, but investors suddenly decided it was time to buy the dollar.
So they did, and now the dollar is in a range ahead of the jobs report in the United States.
Bitcoin dropped against the dollar, too, after trading above $24k for a brief period. At the current levels, it sits dangerously at the lower edge of a reversal pattern.
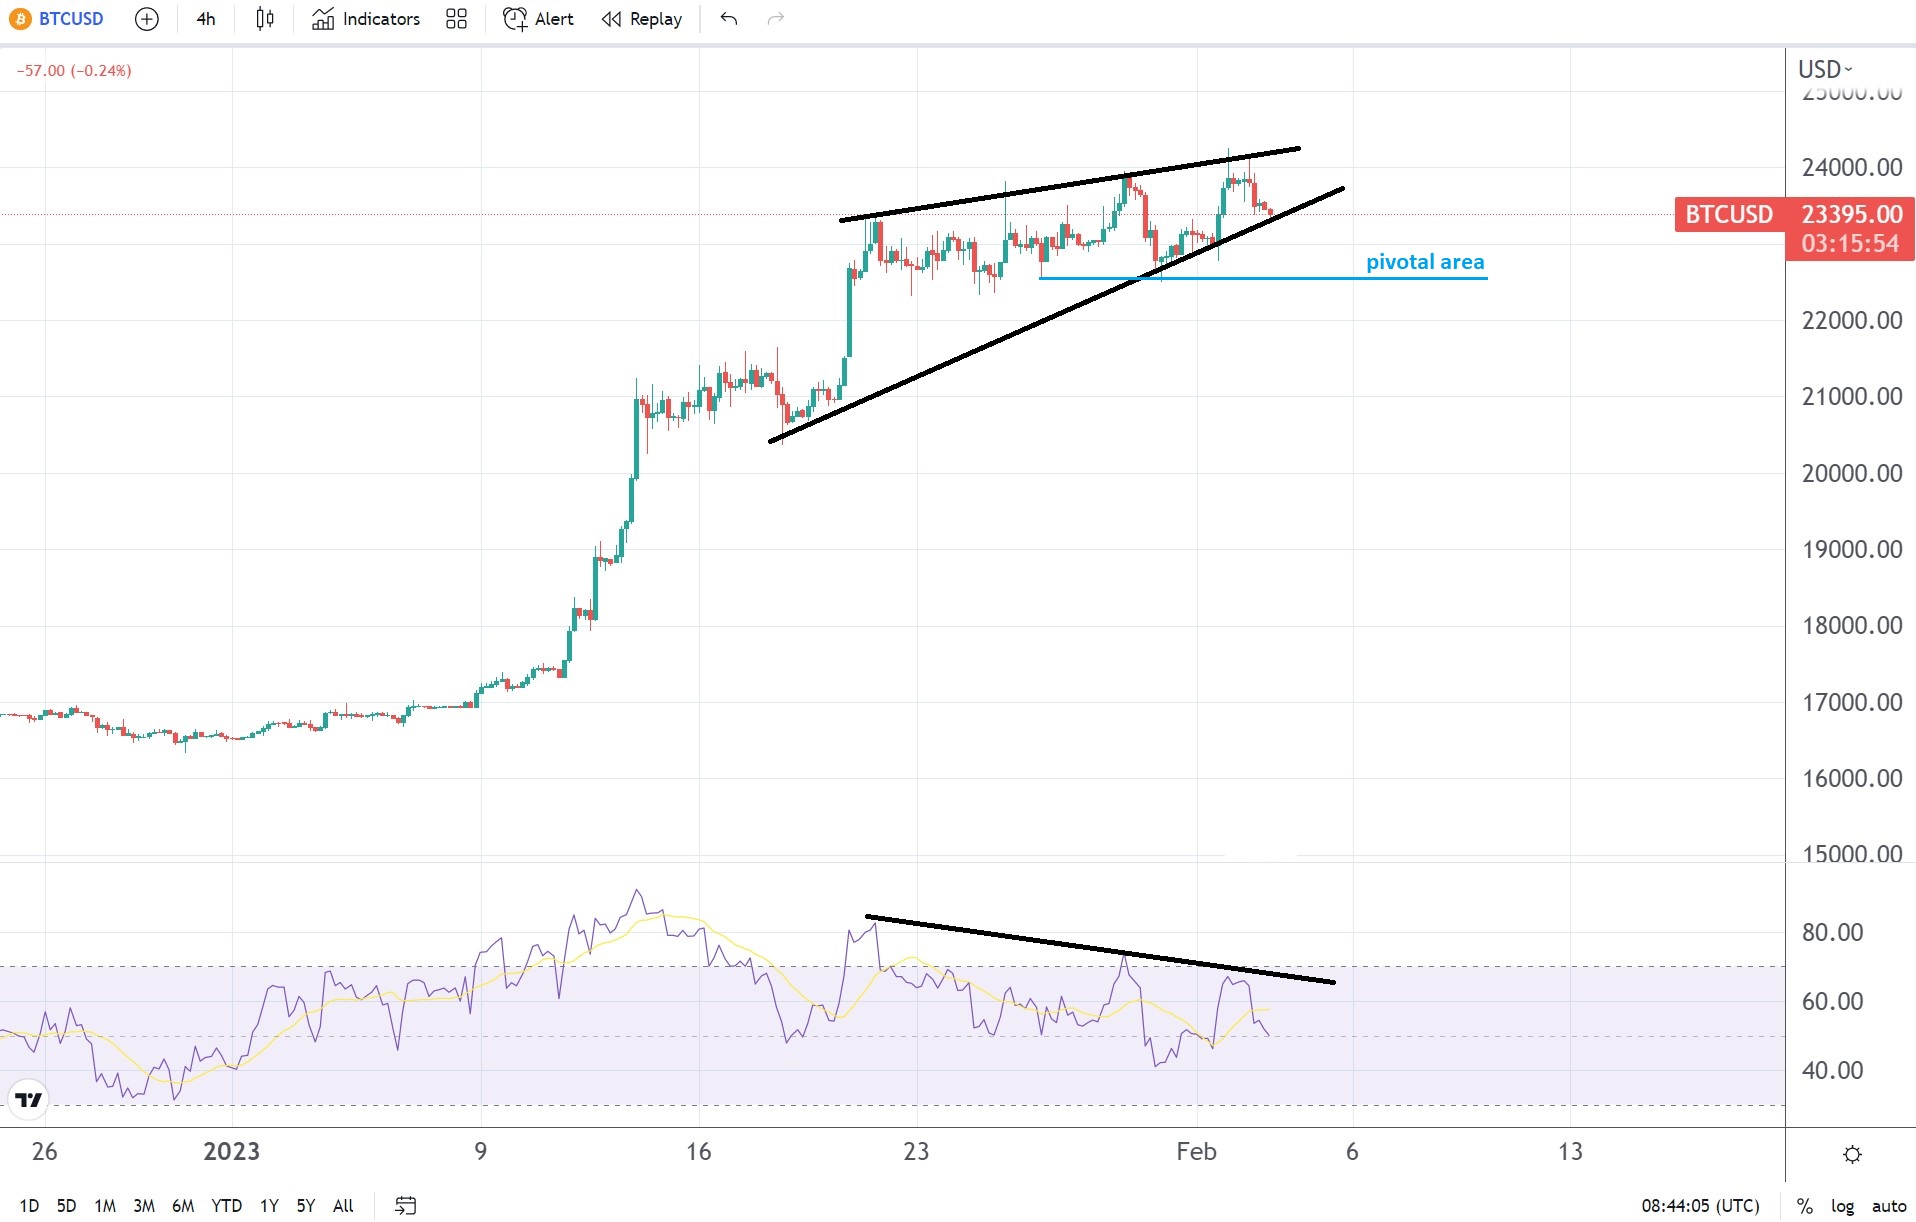
Rising wedge and bearish RSI divergence call for caution
Bitcoin’s price action diverged from the RSI even before the Fed’s decision. A bearish divergence forms when the oscillator, in this case the RSI, fails to make new higher highs. Yet, at the same time, the price action, or the market, does form them.
This way, the two diverge, and the oscillator shows signs of weakness in the market.
Besides the bearish divergence with the RSI, BTC/USD is in a rising wedge formation. This is a reversal pattern, but traders must be patient before shorting the market.
The idea is to wait until and if the market breaks below the pivotal area marked in blue on the chart above. Such a move implies that the reversal pattern ended and a new market move has already started.