
Polkadot (DOT) has rebounded from a $23.04 low and could break to $33.00 if bulls maintain the upside momentum
Polkadot has rallied 11% in the past 24 hours to trade above $29.00 as bulls target more gains.
The immediate technical outlook suggests bulls have an opportunity to retest recent highs above $30. If the current trend holds, buy-side pressure could add about 10% to the DOT/USD pair in coming sessions.
Polkadot price outlook
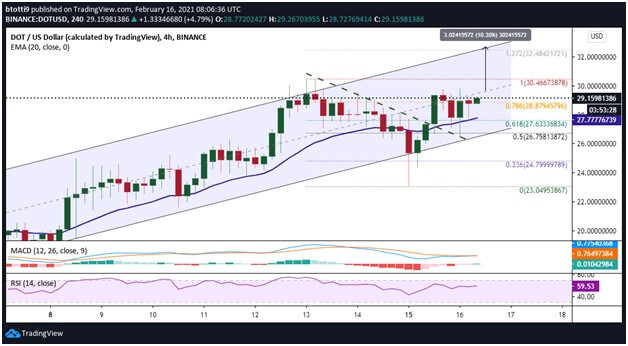
DOT/USD retraced from its peak around $30.46 on 13 February, hitting a low of $23.04 on 15 February. The decline saw DOT price break below a major support level at $25.00, although aggressive buying meant bulls quickly bought the dip and rebounded above the support zone.
A fresh increase has pushed the pair above the 0.5 Fibonacci level of the decline from $30.46 high to $23.09 low. There has also been a clear break above a descending trend line and the 0.618 Fibonacci retracement level of the aforementioned downswing.
Currently, bulls are trying to keep prices above the 0.786 Fibonacci retracement level ($28.87) on the 4-hour chart.
DOT price ready for leg up
Polkadot’s price action over the past few days has seen DOT/USD trade higher within an ascending parallel channel. Despite the minor correction witnessed yesterday, the cryptocurrency’s technical picture remains bullish short term.
DOT is trading above the 20-day EMA and the RSI remains above the midpoint to suggest bulls still have control. Even the MACD that has trended bearish over the past three days is suggesting a hidden bullish divergence as bears weaken.
The primary resistance zone at $28.00—$30.00 coincides with the middle line of the rising channel. A break above this level could see bulls target a swift move towards the upper boundary of the channel.
That would put DOT’s price around $33.00, with the 1.272 Fibonacci retracement level ($32.48) acting as a major upside barrier. Above this level, Polkadot’s price could rally to highs near $40.
DOT/USD downside
If DOT/USD fails to consolidate gains above $28.00, there is potential for a minor correction to the downside. There’s likely to be strong initial support near the 20-day EMA ($27.77). If this holds, a rebound towards the $30.00 will remain in the picture. However, the sell-off pressure will likely increase if the pair breaks below the ascending channel.
In this case, bulls will rely on support at the 0.5 Fibonacci level ($26.75) and the critical horizontal support line at $25.00. Further losses could see DOT/USD decline towards $23.00.