-
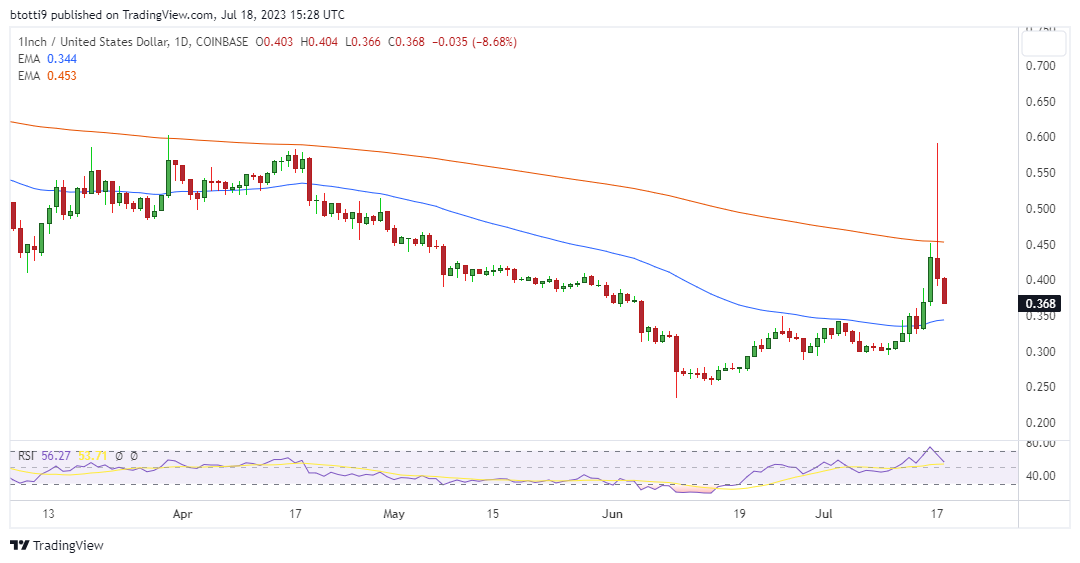
1inch price is down 16% at the time of writing after paring all 24-hour gains from above $0.59.
- The 1INCH token saw massive 24-hour trading volume on Korean exchange Upbit.
- On the technical side, 1INCH is poised above a key support area around $0.34.
The price of 1inch token (1INCH) pumped in early trading hours Monday, reaching highs of $0.59. However, just as quickly as it rose from lows of $0.39, the 1INCH price pared the gains and traded to $0.36.
According to data from CoinGecko, 1inch is down 16% in the past 24 hours as of time of writing, with a look at the weekly time frame showing the token has cut recent gains to just 21%.
This contrasts with the explosive action that characterized the 1INCH market following Ripple’s partial win in its ongoing regulatory battle with the US Securities and Exchange Commission (SEC).
1INCH price outlook- what next?
Like XRP, which pumped more than 100% in the aftermath of Judge Analisa Torres’ ruling last week, 1inch price was mainly boosted by huge volume on the South Korean crypto exchange Upbit. Indeed, in the past 24 hours, the coin’s trading volume on the Upbit exchange hovered at around 31% of total daily volume.
Yet, trading volume has declined from more than $670 million on Monday to about $120 million at the time of writing – representing an 83% dip in the past 24 hours. As to why 1INCH price is down today, we see an overall negative flip for major cryptocurrencies led by Bitcoin’s fall below $30k and Ethereum’s struggles near $1.9k.
Altcoins, including XRP, BNB and Solana also pared recent gains today. The downward pressure comes as bankrupt crypto lender Celsius Network moved millions of dollars’ worth of altcoins to exchanges for liquidation and conversion into BTC and ETH.[Read more]
1inch token is among those the platform moved to FalconX on Monday in preparation for offloading.
 1inch price on the daily chart.Source: TradingViewIf we look at the technical picture as suggested in the chart above, we have the daily RSI dipping near the equilibrium point to suggest bears could still take a swipe at bulls. 1INCH is also in danger of retreating to the 50-day exponential moving average.
The moving average currently offers a buffer zone near $0.34. On the upside, 1INCH is facing long term resistance as signaled by the 200-day EMA – currently at $0.45 after the coin’s dip from above $0.59.

