Ripple (XRP/USD) is the best of both worlds. It was established by Ripple Labs in 2012 as a cheaper and faster means of payment compared to traditional platforms like SWIFT and digital currencies.
Transactions are confirmed by a small number of servers owned by banks through a consensual mechanism. This method is unlike the proof-of-stake mechanism used in Bitcoin and other digital assets.
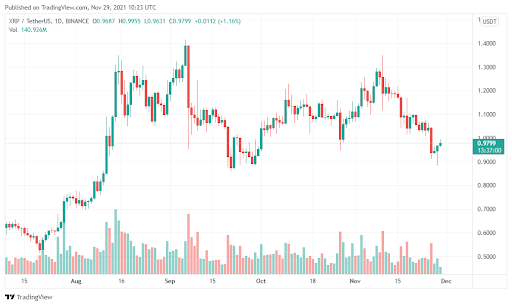
As of the 29th of November, 2021 – Ripple is ranked in 7th place on CoinMarketCap.com (the encyclopedia of digital assets). It has an all-time high (ATH) of $3.40 which it hit in January 2018. On March 13, 2020, it hit an all-time daily low of $0.12. Its current price ranges between $0.8966 and $0.9942. It has a daily trading volume of over $2.5 billion.
 XRP daily candlestick chart (source: TradingView)
XRP has a total supply of 100 billion, with only a little above 47 billion in circulation. The current market capitalisation of XRP hovers above $ 46.5 billion.
In the United States, XRP has been delisted from many exchange platforms due to the lawsuit filed against them by the Securities and Exchange Commission in December 2020. American IP addresses and traders from the United States face restrictions and trading limits on the platform.
Summary
Although XRP has witnessed a steady downfall from 2018, which persisted all the way till 2019, and part of 2020, it has hopes of rising again. Since November 2020, XRP has steadily but slowly been on an overall upward trend; it even hit a high of $1.96 on April 14, 2021.
Resolving the lawsuit against them by the US SEC could potentially cause a surge in prices again.

