-
Aptos price has been in a strong bullish trend in 2023.
-
Its DeFi TVL has plunged in APT terms.
-
The number of users in its ecosystem has been falling.
Aptos (APT/USD) price has done spectacularly well in 2023, making it one of the top-performing coins in the industry. The coin peaked at $20.44 in January, which was about 448% above the lowest point this year, as we wrote here. However, a closer look at its network shows that things are not going on well.
Aptos on-chain metrics concerns
Aptos, formerly known as Diem, is a relatively new blockchain that acts as a good alternative to Ethereum, BNB, and other smart contract platforms. The network has been growing rapidly in the past few months.
However, a closer look at its on-chain and ecosystem numbers paint the opposite picture. For example, Aptos total value locked (TVL) in DeFi has been in a strong growth in dollar terms in the past few months. It stands at an all-time high of $76 million.
At face value, this trend seems good. However, when you switch to the TVL in Aptos terms, which is the one that matters, shows that it has been falling. Aptos now has a TVL of 4.26 million APT, which is lower than its all-time high of over 17.6 million APT.

Other Aptos metrics also send a disturbing picture of the network. For example, according to AptosScan, the number of transactions in the network has been in a strong downward trend and is now hovering near its all-time low. Aptos handled 612,715 transactions on January 17, lower than its all-time high of over 2 million.
Address growth in the ecosystem has also been falling after it peaked at over 800k last year. On January 17, Aptos had about 9.500 addresses. The number of transaction fees and address growth have also lagged.
Couple all this with the network’s poor tokenomics. Its documents showed that most of these tokens are held by insiders. As such, there are significant concerns about the network.
Aptos price prediction

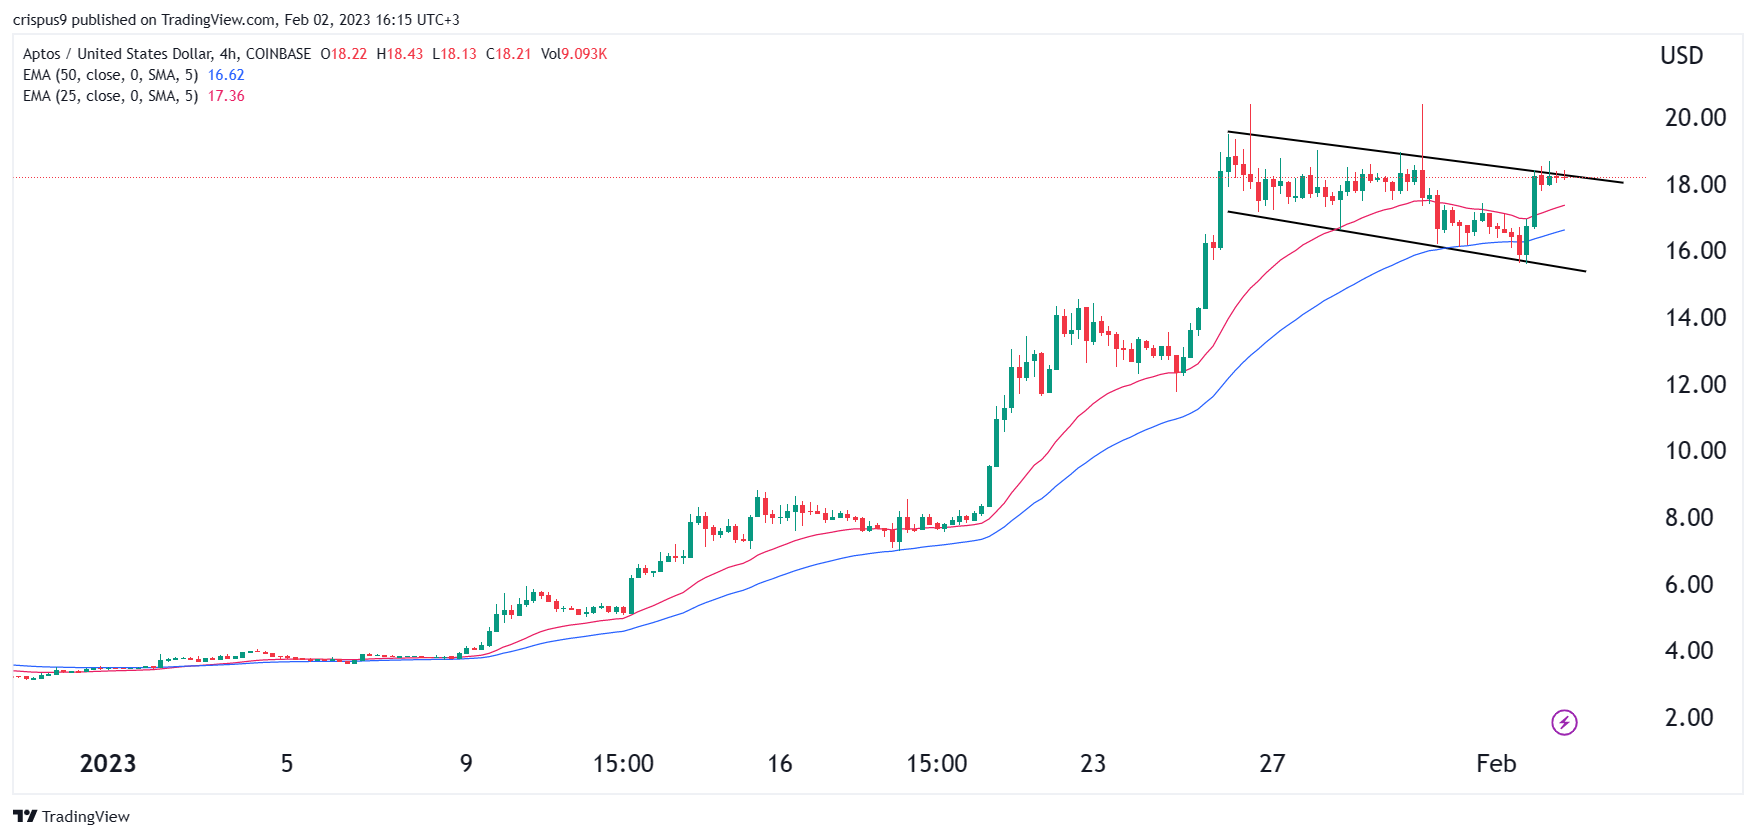
The simple reason why Aptos price has been rising is simply that it has been rising. When a coin is rising, it leads to FOMO among traders. Turning to the daily chart, we see that the APT price has been in a strong bullish trend in the past few months.
Most recently, it has formed a descending channel that is shown in black. This price is at the upper side of this descending channel. This channel has a close resemblance to a bullish flag pattern. It is also being supported by the 25-day and 50-day MA. Therefore, Aptos will likely have a bullish breakout in the coming weeks.

