-
Cosmos has recorded a 32% jump in daily trading volumes
-
ATOM/USD is trapped in an ascending triangle
-
Technical indicators are bullish
Altcoins, cryptocurrencies alternative to Bitcoin, are currently on a summer relief. The recovery has driven the overall market cap to $1.15 trillion. One platform that has recorded significant trading volumes is Cosmos ATOM/USD.
Despite native ATOM dipping 4.84% in the past day, the daily trading volumes are up 32% at $192 million. Apart from the overall crypto sentiment, Cosmos derives its bullishness from the strong fundamentals around it.
Commonly referred to as ‘the internet of blockchains’, Cosmos supports hundreds of dApps. It is designed as a network of autonomous blockchains connected through an Inter-Blockchain Communication protocol. It is deemed as the most diverse ecosystem and is attracting small and large projects alike. The activity is driving demand for its native ATOM token.
From the weekly chart, ATOM has recorded a weekly high of $12.32 and a low of $10.69. The weekly resistance is currently set at $17.56. The bullish trend is even clearer in the daily chart below.
ATOM/USD trades in an ascending triangle

Source: TradingView
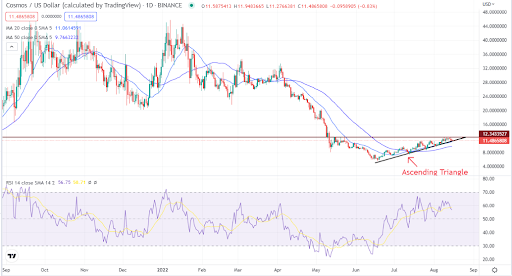
The technical outlook shows that ATOM is trading within an ascending triangle. The asymmetric triangle shows a possible continuation of an uptrend. ATOM has severally bounced the lower part of the triangle and is currently on a slight retracement. ATOM has established $12.34 as the next resistance level.
From the chart, a breakout above the level could trigger a strong bullish momentum. However, a drop below could cause aggressive selling, and ATOM could retest $9 support. Currently, ATOM is exchanging for $11.34.
The token is above the 20-day and 50-day moving averages. The RSI is at 55, meaning that there are more buyers than sellers.
Concluding thoughts
ATOM is currently locked in an ascending triangle with a potential of a breakout. A breakout above the triangle could usher in a strong bullish momentum, and the reverse is true. Investors should watch out for a breakout before placing a buy or sell entry.

