- Avalanche active addresses have increased 2x compared to yearly average.
- Data shows monthly active addresses recently hit 1.21 million.
- However, AVAX price has traded lower this week amid Bitcoin’s struggle to hold above $30k.
Avalanche, a layer 1 blockchain developed by Ava Labs, has seen a steady increase in active addresses over the past month.
On-chain data shows daily active users on the blockchain network surged twofold in June, well above the average recorded over the past year.
According to crypto market intelligence provider Messari, most of the engagement in this period has been around decentralised exchanges, including retail-focused DEX Trader Joe and Web3 protocol Galxe.
.@avax witnessed a surge in daily active users, doubling compared to the average over the past year.
Engagement revolves around DEXs like @traderjoe_xyz and applications like @Galxe.
Avalanche aims to revitalize its network and foster a stronger #DeFi ecosystem. pic.twitter.com/Q3yLcZV2D1
— Messari (@MessariCrypto) June 29, 2023
Data from Avalanche explorer Avascan shows the network recently hit 1.21 million monthly active addresses.
But can AVAX price benefit from the network activity as the platform looks to reclaim its market share via a boost to its DeFi ecosystem?
AVAX price outlook
Avalanche’s TVL has fallen from $13.93 billion in December 2021 to currently sit around $1.4 billion.
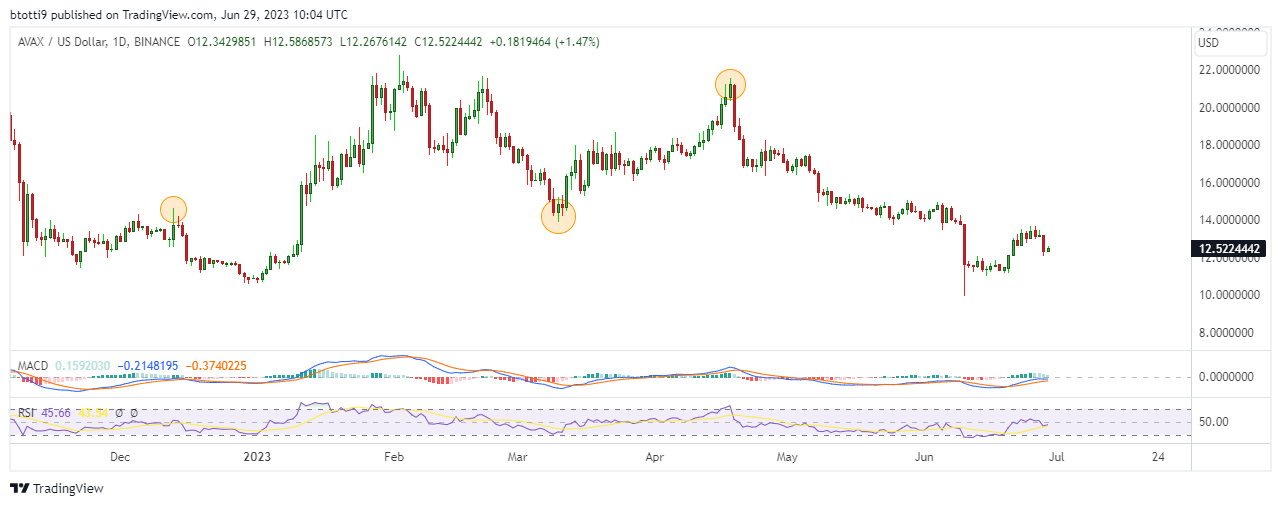
Meanwhile, AVAX has traded lower over the past week since bulls hit resistance near the $13.70 level on Sunday. The crypto token is down 3% in the past 24 hours and 5% in seven days as buyers attempt to keep the bears off near $12.50.
As can be seen in the price chart below, AVAX is battling for upside momentum at the same time as Bitcoin (BTC) bulls look to stem bearish advances near the critical $30k level. A new spike for BTC could inject some buoyancy in altcoins and see AVAX/USD reclaim the $14 area.
That could push Avalanche prices to the peak seen in April when bulls broke above $20, with such a move representing a 100% flip from June lows of $10.

Avalanche daily chart. Source: TradingView
However, the daily chart has the RSI below the 50-mark, suggesting buying pressure that pushed AVAX from $11.45 to around $13.70 has reduced.
The MACD is also indicating weakness on the side of buyers. A flip to the upside in the indicators will highlight potential gains while the opposite will threaten a return to key support range around $11.20 – $9.50.

