Bancor (BNT) price rocketed over 28% in 24 hours as traders prepared for the listing of the token on major crypto exchange Coinbase
Bancor token is among the three newly listed tokens on cryptocurrency trading platform Coinbase Pro that have seen their respective prices post massive gains in the past 24 hours.
The price of Bancor against the US dollar has spiked more than 28% to hit highs of $1.41. At the time of writing, the cryptocurrency is trading around $1.33 and looks poised to retest the intraday highs as bulls target another upside that would bring $2.0 into play.
The other two tokens to see an uptick in prices after Coinbase announced trading support are Aave (AAVE) and Synthetix (SYN). AAVE is up 6.7% to currently trade around $87.17, while SYN/USD is changing hands around $5.25 after surging nearly 11%.
BNT/USD price
Data from IntoTheBlock’s In/Out of the Money Around Price shows bulls face a relatively easy path on the upside. As per the chart below, the BNT price at the current level of $1.33 faces no major resistance until around $1.66. If bulls surmount the expected rejection at the level, the next target will be $2.

Should the short term bullish momentum fade off, BNT price will likely decline to lows of $1.15. This is a major support level with over 1,250 addresses shown to have purchased more than 30 million worth of BNT tokens.

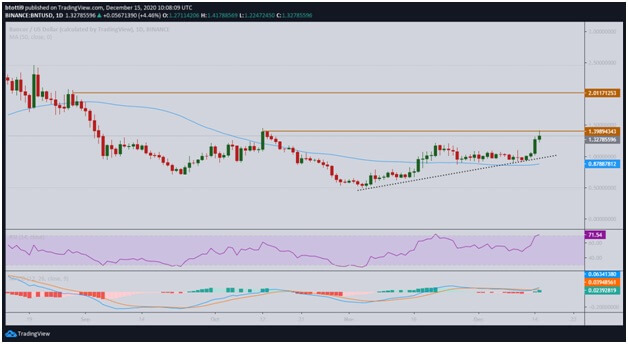
On the daily chart, the RSI is ticking upwards into the overbought region. Meanwhile, the MACD presents a bullish divergence to suggest bulls are strengthening. The immediate resistance line lies at $1.40, above which increased upward pressure will likely push BNT/USD to $2.01.
On the downside, a dip under $1.30 could push prices to the trendline of an ascending triangle pattern near $1.00. If there’s additional bearish action, bulls can look to absorb the sell-off pressure at the 50-day moving average that currently sits around $0.87.

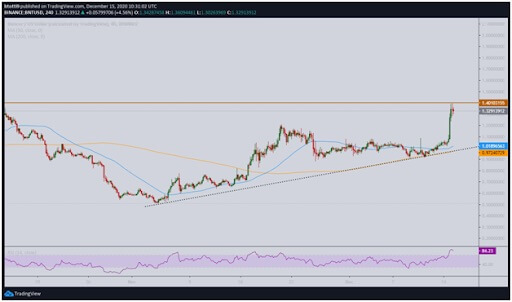
On the 4-hour chart, Bancor’s price has turned slightly lower after hitting an upside barrier at $1.40. The level marks the upper limit of an ascending triangle pattern. Bulls need to crack this line to continue the uptrend seen over the past few days.
The RSI has begun to dip although it remains within the overbought territory. The MACD on the other hand features a hidden bearish flip that could see bulls struggle to keep prices above $1.30.
If bears succeed at breaking below the above support level, BNT/USD could slip to the 50-SMA (4-hour chart) at $1.01 and then 200-SMA at $0.97.

