UMA Protocol price jumps 13% as traders look forward to trading on Coinbase Pro.
The recent crypto crash saw the price of decentralized protocol UMA token dip from all-time highs of $27.63 on September 1 to lows of $9.79 on September 5.
However, after Coinbase announced the listing of UMA on its professional trading platform, the price began to pick an uptrend.
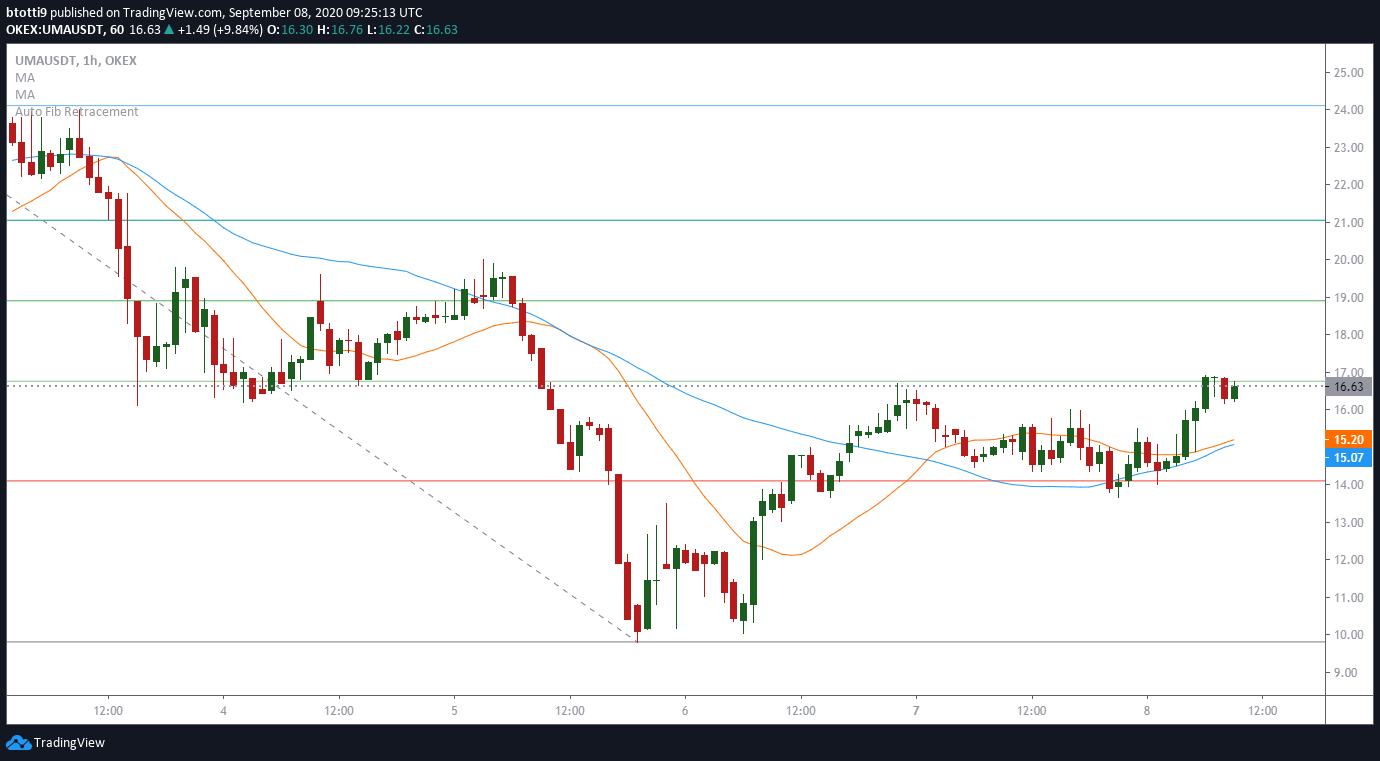
The past 24 hours have seen the token’s value against the US dollar surge to hit an intraday high of $16.92. Bulls now aim for a close above $16.00 to confirm a bullish reversal that could see more upside above $20.00 within the next few days.
UMA will begin trading on Coinbase Pro on Tuesday, September 8, with the coin likely to see further upside similar to those registered by recently added Compound (COMP), Celo (CGLD), Band Protocol (BAND), and OmiseGo (OMG).
UMA Protocol, a rival of oracles platforms ChainLink and Band Protocol, recently upped its yield farming bait with the launch of a “Yield Dollar.” To achieve the tokenization, the platform has partnered with liquidity protocol Ren to allow users to lock renBTC into UMA and mint the uUSD yield dollar.
According to an announcement published on September 7, investors can stake the minted uUSD via a Balancer pool and earn yield rewards from three tokens: BAL, REN, and UMA.
Short term technical outlook
UMA Protocol’s price is slightly under pressure on the hourly chart, with UMA/USDT dipping marginally to lows of $16.28 as of 08:00 UTC (September 8).
But bulls have still managed to push the token higher, nearly 13% on the day-to-day basis and by more than 5% in the last hour.
To cement the recovery, the DeFi token needs to clear resistance at $17.00 and the 1.271 retracement level marked on the downswing from highs of $19.56 to lows of $9.79.

The Relative Strength Index indicator on the hourly chart is slightly downturned around 62, suggesting bulls hold the advantage. But this is likely to be crucial only if they can keep the price above $16.00 and the 76.8% retracement level ($16.07) – it’s a level that broke before last week’s deep retracement.
If bulls fail to hold onto gains here, a dip is likely to push the token to support levels at the 20-day and 50-day simple moving averages at $15.20 and $15.07 respectively.
UMA is, at time of writing, trading around $16.83 against the US dollar.

