


Binance Coin (BNB) has surged by more than 7% in the past 24 hours and continues to outperform major cryptocurrencies Bitcoin (BTC), Ethereum (ETH) and Ripple (XRP).
Binance Coin is trading higher and could test prices around $30.00 in the next few sessions.
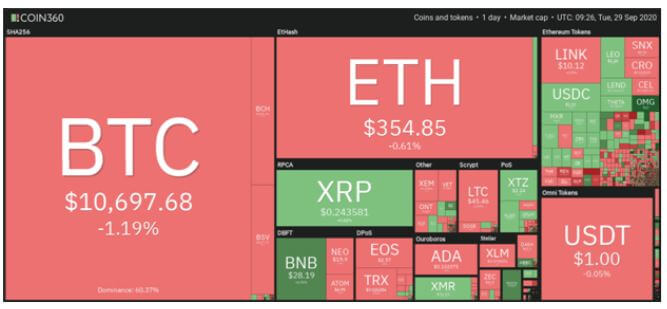
Meanwhile, most of the largest cryptocurrencies by market cap are showing signs of weakness at crucial price levels. BTC/USD has broken below $10,700, ETH/USD is struggling around $350 and XRP/USD is flat around $0.244.
The picture is the same over a large section of the cryptocurrency market. Assets trading green include OmiseGo Network (OMG), ABBC Coin (ABBC) and Binance Coin (BNB).
Binance Coin is looking to sustain an uptrend that has seen bulls push above $28.00, coming after its latest upside ended with a pullback to lows of $21.30 from its 2020 peak around $33.50
Binance lists CAKE and SPARTA
Bullish sentiment around BNB had been building over the past couple of weeks before widespread selling pressure put paid to buyers’ efforts.
However, although the downward pressure saw the BNB price sink to lows of $21.3, bulls have successfully pushed back to see it back above $27.00. In the past 24 hours, BNB/USD has jumped 7.74% to suggest an assault at the $30.00 ceiling is more likely.
And the upside comes on the back of Binance announcing the listing of two new DeFi projects in its Innovation Zone.
“Binance will list PancakeSwap (CAKE) and Spartan Protocol (SPARTA) in the Innovation Zone and we will open trading for CAKE/BNB, CAKE/BUSD and SPARTA/BNB trading pairs at 2020/09/29 8:00 AM (UTC). Users can now start depositing CAKE and SPARTA in preparation for trading” the exchange noted in a blog post published September 29.
BNB/USD price outlook
On the 4-hour chart, BNB has printed a succession of higher highs and higher lows since September 24.
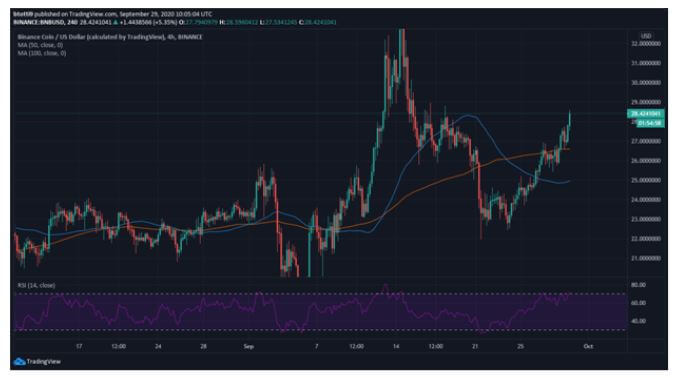
The RSI is crossing into overbought territory and a bearish divergence formation might suggest a short term reversal. If this happens, bulls have support at the 100 MA at $26.59 and the 50 MA at $24.96.
The outlook gleaned from the daily chart suggests a bullish scenario. As can be seen in the chart below, the MACD is just turning bullish, while the price is currently well-supported above the 20 EMA and 50 MA. If the MACD cuts bullish, the chances of an extended upside increase and BNB/USD could revisit resistance around previous yearly highs around $33.00.
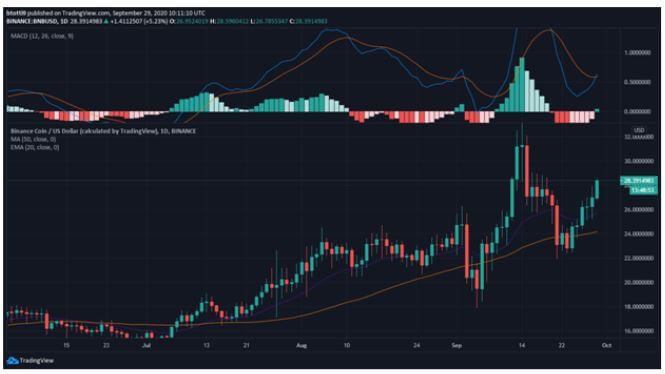
Conversely, a bearish breakout out could see bulls aggressively defend gains at the previous weekly lows around $24.00-$21.00.
BNB/USD is trading around $28.57 as of writing.