BNB/USD could retest highs near $300 if bulls build upside momentum above $250
Binance Coin (BNB) is trading just above $241, down by about 2% in the past 24 hours. The altcoin is also nearly 3.5% in the red over the past week. Looking at these figures, it might not click that Binance Coin has been one of the outperformers of the crypto space year-to-date.
BNB changed hands at lows of $36.66 on 1 January, before rallying and then exploding to touch highs of $366 on 19 February. The staggering performance saw Binance Coin break into the top three coins by market cap, although it has since dropped to the 4th spot behind Cardano (ADA) with a market cap of $37 billion.
A downtrend to lows of $194 saw bears reclaim more than half of the gains before buyers broke above the descending trend line. This saw BNB price trade as high as $268 on 1 March.
However, increased sell-off pressure has restricted the upside under $250, with bulls seeking fresh momentum to push higher.
Binance Coin price outlook
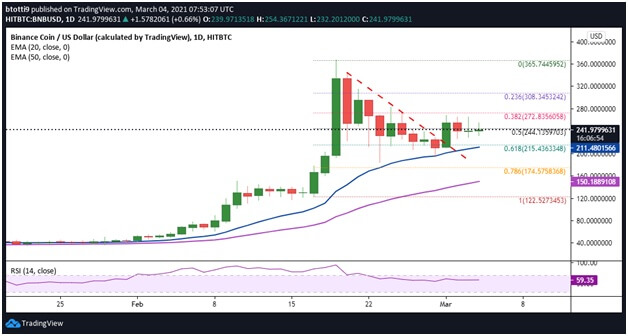
Binance Coin remains above a downtrend line formed on the daily chart when BNB/USD plummeted to lows of $194. As the candlesticks on the daily chart show, bulls have managed to hold above $240 over the past two days despite bears’ attempts to pull lower.
Keeping prices above the trend line could allow bulls to attack the supply barrier at $244. This is where sellers have mounted strong resistance over the past 48 hours, an area that has the 50% Fibonacci retracement level of the swing from $268 high to $194 low.

If bulls manage to break above this barrier, the next target could be the 38.2% Fib level at $272. Although bears are likely to fight back here, bulls could push for a retest of $300, with the 23.6% Fib level presenting the next major hurdle at $308.
A contrary view would be if BNB/USD flips lower. The primary support zone has the 61.8% Fib level ($215) and the 20-day exponential moving average ($211). Bulls could defend gains around this zone and see BNB price trade sideways for a while.
However, if the price slips further and breaks support at the $200 level, a dip to the 50-day EMA ($150) could be possible in the short term.

