Binance Coin (BNB) price had dropped to $239 amid increased selling pressure
Binance Coin has seen its price rebound off lows of $239 following widespread profit booking across the crypto market. The BNB coin’s price dropped from highs of $267 to the aforementioned lows, with an attempt by bulls to post an immediate reaction that resulted in recovery near the $263 level.
Now that the overall sell-off in the market has eased somewhat with Bitcoin’s rebound above $55k, BNB bulls are looking to take cue and target prices above a key resistance line.
BNB/USD price analysis
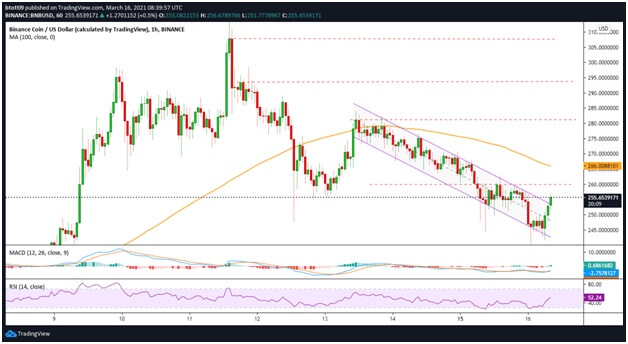
BNB price failed to hold above $300 and quickly descended after a massive sell-off hit BTC on Monday. The hourly chart shows the cryptocurrency’s price continued lower after breaking beneath the 100-hourly simple moving average.
The profit-booking likely from panicked traders saw BNB/USD fluctuate within a descending parallel channel. But as the long-tailed candlesticks printed on Monday and Tuesday morning show, bulls remain aggressive.
The battle has seen buyers seize the slowdown as an opportunity. So far, bulls have purchased the last two major dips (this week) with BNB price rebounding higher each time.
At the moment, the Binance Coin price is trending north above the upper limit of the parallel channel.
The RSI has climbed above the midpoint and is currently printing 51 on the hourly log to suggest the advantage is with the bulls. The hourly MACD is also pointing towards a possible bullish flip.

The BNB/USD pair is likely to target the next resistance level presented by a horizontal line near $260. If this works out, a fresh upside will push prices beyond the crucial 100 SMA ($266).
If the upward momentum sustains short term, a close above $266 could help bulls pierce the bearish wall near the critical supply zone at $280. This could allow for a retest of the $300 level, which would then open up the path to a potential rally to the all-time high price of $342 reached on 19 February.
On the contrary, the BNB/USD could retreat into the descending channel and trade sideways between $250 and $240. If it breaks lower, the next support might be located at the psychological $200 level.

