


- Bitcoin Cash (BCH) gains mirror Bitcoin’s surge to near $70k.
- With Bitcoin Cash price rising above $450, are bulls strong enough to eye further gains?
Bitcoin Cash (BCH) rose more than 14% in 24 hours to trade above $450, its highest level since mid-June.
BCH gained as Bitcoin (BTC) moved to within reach of $70,000 following a 3% rise in 24 hours. The benchmark digital asset traded around $69,503 at the time of writing on July 29, slightly off its intraday highs above $69,800 reached during the Asian trading hours.
BCH price: Are Bitcoin Cash bulls back?
Bitcoin Cash, like Bitcoin, has in the past few weeks navigated a tough terrain in terms of sell-off pressure related to potential Mt. Gox selling.
However, Bitcoin remains above $60k with a good chunk of the staggering $9 billion worth of BTC that the defunct crypto exchange announced would be going to customers. This resilience has also shown with Bitcoin Cash, which continues to ride positive sentiment as Mt. Gox customers choose to hodl rather than sell.
Crypto is also upbeat after last week’s Bitcoin 2024 conference that saw former US president Donald Trump make major announcements related to Bitcoin and cryptocurrencies. With elections on the horizon, Trump pledged to make America the home of crypto and to establish a Bitcoin reserve for the US among other key remarks.
According to Kim Dotcom, there’s no fear that the US government will ban crypto.
Crypto is going to pump big time. The fear of US Govt bans against crypto is over. Legitimacy has been established. The whales lobbied all political camps and they succeeded. As the US dollar is weakening crypto will rise. My favorite is Bitcoin Cash. https://t.co/DIOiBCxaVJ
— Kim Dotcom (@KimDotcom) July 27, 2024
BCH price prediction
The Bitcoin Cash price surging above $400 has the cryptocurrency testing a key resistance zone.
A move above this means bulls have broken above a robust horizontal resistance line. Price is currently retesting a previous support area, above which the altcoin could eye a new year-to-date high.
In this case, the psychological level at $1,000 will be a major short term target, while a run to the 2021 bull market highs remains possible if Bitcoin leads crypto into another mega run.
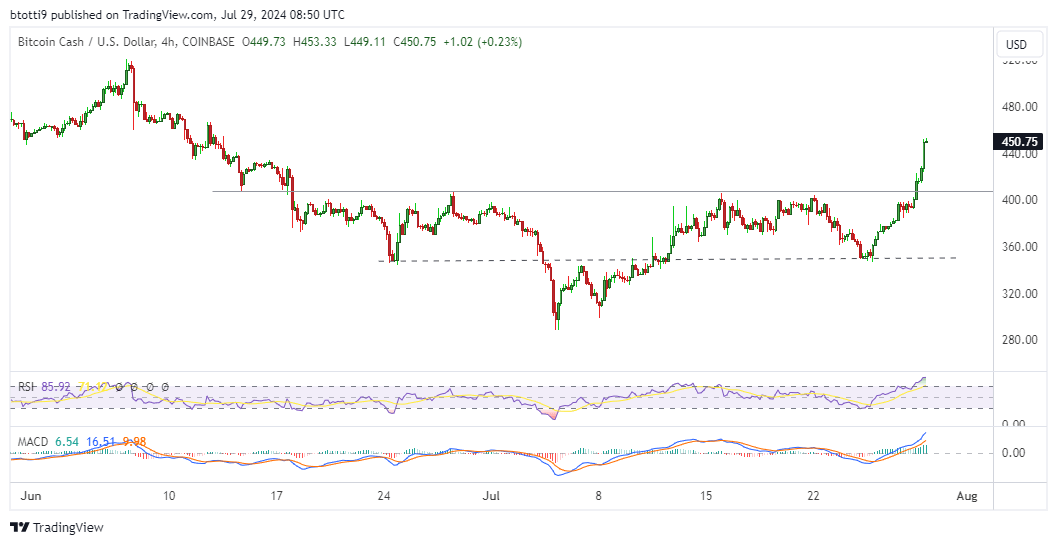
The daily chart shows the Relative Strength Index (RSI) supports buyers as does the Moving Average Convergence Divergence (MACD) indicator.
Potentially, BCH will see a retest of the horizontal line before surging again. However, a breakdown will likely push prices to the primary support area around $350.