BCH price notched an impressive 54% upside to hit $1,484 for the first time since May 2018
Bitcoin Cash (BCH) has made significant gains over the past few days, with the price of the Bitcoin fork rallying 23% on the day as bulls seek a fresh upside. After declining consecutively from 17-25 April, BCH picked up a nice uptrend that culminated in a massive 54% spike on 5 May.
BCH price shot from $950 to $1,484.95 on Coinbase, bringing bulls very close to the $1,500 price mark.
Although some profit-taking has seen the cryptocurrency shed some of its gains, a new uptrend looks more likely.
Bitcoin Cash price and the DOGE effect
As Bitcoin Cash surged to a new multi-year high, a similar trend was observed for Ethereum Classic (ETC) and Bitcoin SV (BSV). The three altcoins, which have largely lagged behind the rest of the market for most of the current bull cycle, have each seen respective booms to reach new highs.
ETC price is up 20% over the last 24 hours and 173% in the past seven days, while BSV has notched 10% and 39% respectively to currently trade at $396.
According to Barry Silbert, the founder and CEO of Digital Currency Group that also owns Grayscale and Genesis Trading, traders on Robinhood could be rotating profits from Dogecoin (DOGE).
https://twitter.com/BarrySilbert/status/1389723168022175760
The same outlook is also shared by Alex Kruger, an economist and trader who believes money from Dogecoin has been spilling into BCH, BSV and ETC.
#Doge wealth effect spilling over to the RobinHood alts: $LTC $BCH $BSV $ETC. No other alts available on RH yet.
Expect RH listings to be a major driver of future returns. pic.twitter.com/i37zaJwGh9
— Alex Krüger (@krugermacro) May 5, 2021
BCH price analysis
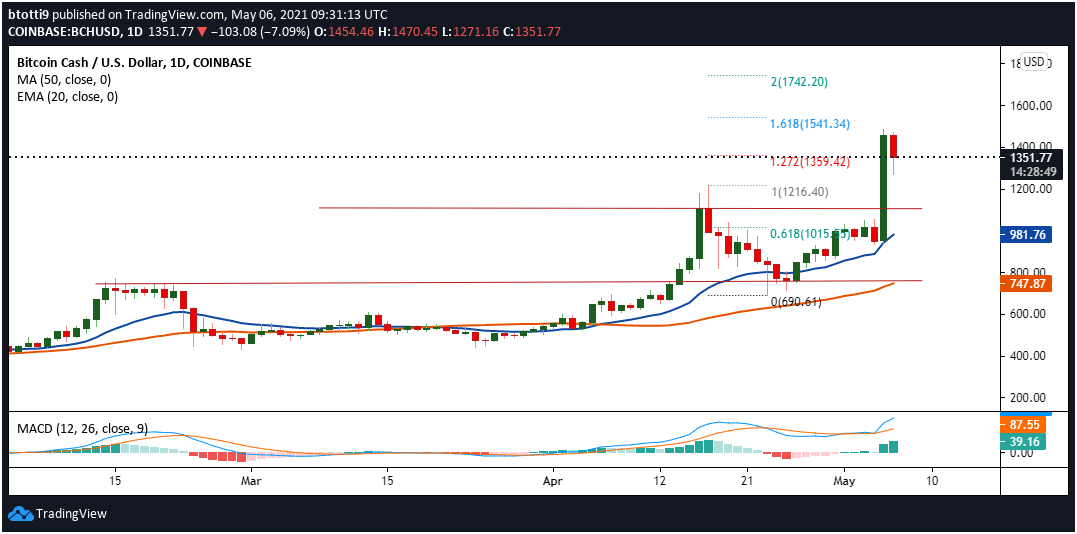
BCH/USD rose by 54% on 5 May to touch a new multi-year high of $1,484.95 on major trading platform Coinbase. The massive candle took prices above the 61.8% Fibonacci retracement level at $1,015 and a horizontal resistance line at $1,107.
The upside has continued as Bitcoin Cash broke above the previous high of $1,216 and the 127.2 Fib extension level ($1,359).
There’s some resistance as seen on the daily chart, with intraday lows of $1,271 suggesting some profit-taking is happening at these levels.

BCH/USD daily chart. Source: TradingView
However, the BCH market remains strong, as suggested by the bullish MACD and the upward curve of the moving averages.
If bulls buy the dip and push prices above $1,359, the BCH/USD pair could move towards $1,400. A successful retest and breakout north of this supply zone could allow buyers to target the next major barrier at the 168.1% Fib level ($1,541). Any more gains above this level could see bulls take a run at $1,742.
On the downside, Bitcoin Cash price could drop to initial support at $1,216. If bears intensify pressure and subdue bulls here, there are high chances prices will drop to the major demand reload zone at $1,015. The 20-day EMA at $978 and 50 SMA at $747 provide robust support if the market flips bearish.

