

While bulls remain in control above $38k, BTC price could dip to $36k if bears succeed in breaching a key support level on the daily chart
Bitcoin (BTC) is up 3.6% in the past 24 hours as bulls battle selling pressure amid optimism that the benchmark cryptocurrency could yet again break the $40,000 barrier and seek last week's highs of $42,629.
Yesterday, Bitcoin price jumped 4% after positive comments from US Securities and Exchange Commission chair Gary Gensler about BTC. Speaking to CNBC, Gensler said that he is "pro innovation" and that he supports favourable crypto regulations designed to help the industry grow.
As of writing, Bitcoin's price is hovering around $39, 405, with cumulative intraweek losses of 2.2%. The BTC/USD pair has a 24-hour range of $37,703 to $39,979, suggesting that bears are not taking bulls' advances lightly as seen during early Thursday action.
According to pseudonymous crypto analyst Rekt Capital, Bitcoin needs to break $40,000 to see further growth, although a pullback to lows of $36,000 or lower is still possible.
If this recent #BTC bounce is merely a relief rally to flip the 200-day EMA back into resistance…
Then $BTC could pullback towards the blue 50-day EMA
The 50 DEMA is another EMA that has historically proven to be useful in supporting Bull Market uptrends#Crypto #Bitcoin pic.twitter.com/AWwP5jomvv
— Rekt Capital (@rektcapital) August 4, 2021
Bitcoin price outlook
On the weekly chart, BTC/USD leans slightly bullish with price above the 50MA and the RSI in the neutral zone while the MACD suggests a possible bullish flip. Also, the price high of the current candlestick is above the previous close, meaning bulls have the advantage if price stays above support at around $38,409.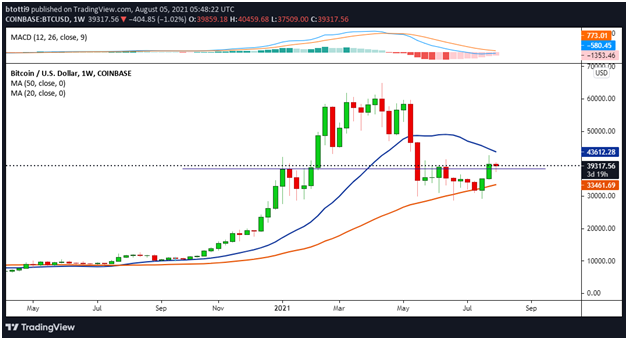
BTC/USD weekly chart. Source: TradingView
The bearish picture might, however, intensify if prices continue lower over the next three days, with a declining 20MA indicative of bearish pressure. The prognosis, therefore, suggests another upside will see bulls target the $43,600 resistance zone. On the downside, the main support is near $33,450.
The daily chart looks more promising despite yet another rejection around the $40,000 level. The downturn followed the appearance of a Doji candle with the high price settling at the previous candle's close on 29 July.
BTC/USD moved higher as indecision appeared to resolve in the bulls' favour, but the next four candles worked out the correction to form highs of $42,496 before a textbook bounce off the 38.2% Fibonacci retracement level at $37,532.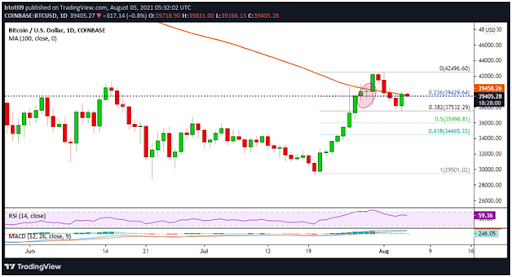
BTC/USD daily chart. Source: TradingView
However, bulls are currently battling downward pressure near the 23.6% Fibonacci retracement level at $39,430. If fresh price dips occur, the crucial 38.2% Fib level offers the immediate anchor.
Other support levels are likely to be found at the 50% and 61.8% Fibonacci retracement levels around $35,999 and $34,465 respectively.