

BTC declined to lows of $36,413, with the sell-off coming after the cryptocurrency surged to highs of $40,593 on Coinbase
Bitcoin (BTC) price failed to break past resistance at $40,600 on Monday night, which saw the top crypto asset’s value drop to lows of $36,413 during early trading on Tuesday. As of writing, the BTC/USD pair is trading around $37,037, about 3% down on its 24-hour peak.
The leading cryptocurrency by market cap made more modest gains in the wake of Amazon refuting media reports about the e-commerce giant’s plans to accept Bitcoin payments later this year.
According to Reuters, an Amazon spokesperson has reiterated that the company’s interest in crypto remains, but that “the speculation that has ensued around [its] specific plans for cryptocurrencies is not true.”
Bitcoin price analysis
Glassnode suggests that Monday’s uptick was a result of a short squeeze that happened even as perpetual funding rates channelled a negative trend.
“Indeed, during Monday’s rally, almost $120M in shorts were liquidated in an hour, which largely confirms a short squeeze as a primary driving force,” Glassnode wrote in a newsletter.
According to the firm, the squeeze informed Bitcoin’s immediate outlook which largely favoured shorts and appeared to have been in play as the pullback below $37k threatened to return BTC to the previous resistance zone around $35k.
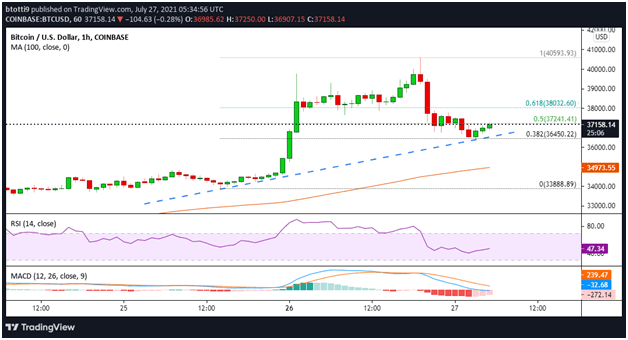
From a technical perspective, the hourly relative strength index (RSI) is below 50, while the moving average convergence divergence (MACD) line is below zero after a bearish crossover to suggest that sellers still hold the advantage. This might see BTC correct, though the RSI climbing towards 50 and the MACD decreasing from its bearish position might hand the initiative to the buyers.
If the price goes lower, the first crucial price level to watch would be the 38.2% Fibonacci retracement of the move from a $33,888 low to a $40,593 high, currently located at $36,450. If sellers take out this support level, the next vital cushion would be at the 100-hour simple moving average at $34,793 and then $33,800.
On the upside, BTC/USD is tracking a bullish trendline as seen on the hourly chart. If buyers continue to consolidate gains above the trendline support, a change in sentiment could trigger buying pressure and see BTC increase above the 50% Fib level ($37,241) and climb towards key resistance at the 61.8% Fib level ($38,032).
Above this zone lies the critical $40,000 level, which bulls have to convincingly clear to flip sentiment their way as they aim for new highs.