- Crypto Capo believes an extended third wave of the current correction could push BTC to achieve bearish targets as low as $21k
- FTM and LUNA are both showing signs of a further downward correction
Well-known crypto markets analyst, Crypto Capo, has said that Bitcoin's recent recovery in the markets during the February mini-surge could soon be defied by a strong descent move.
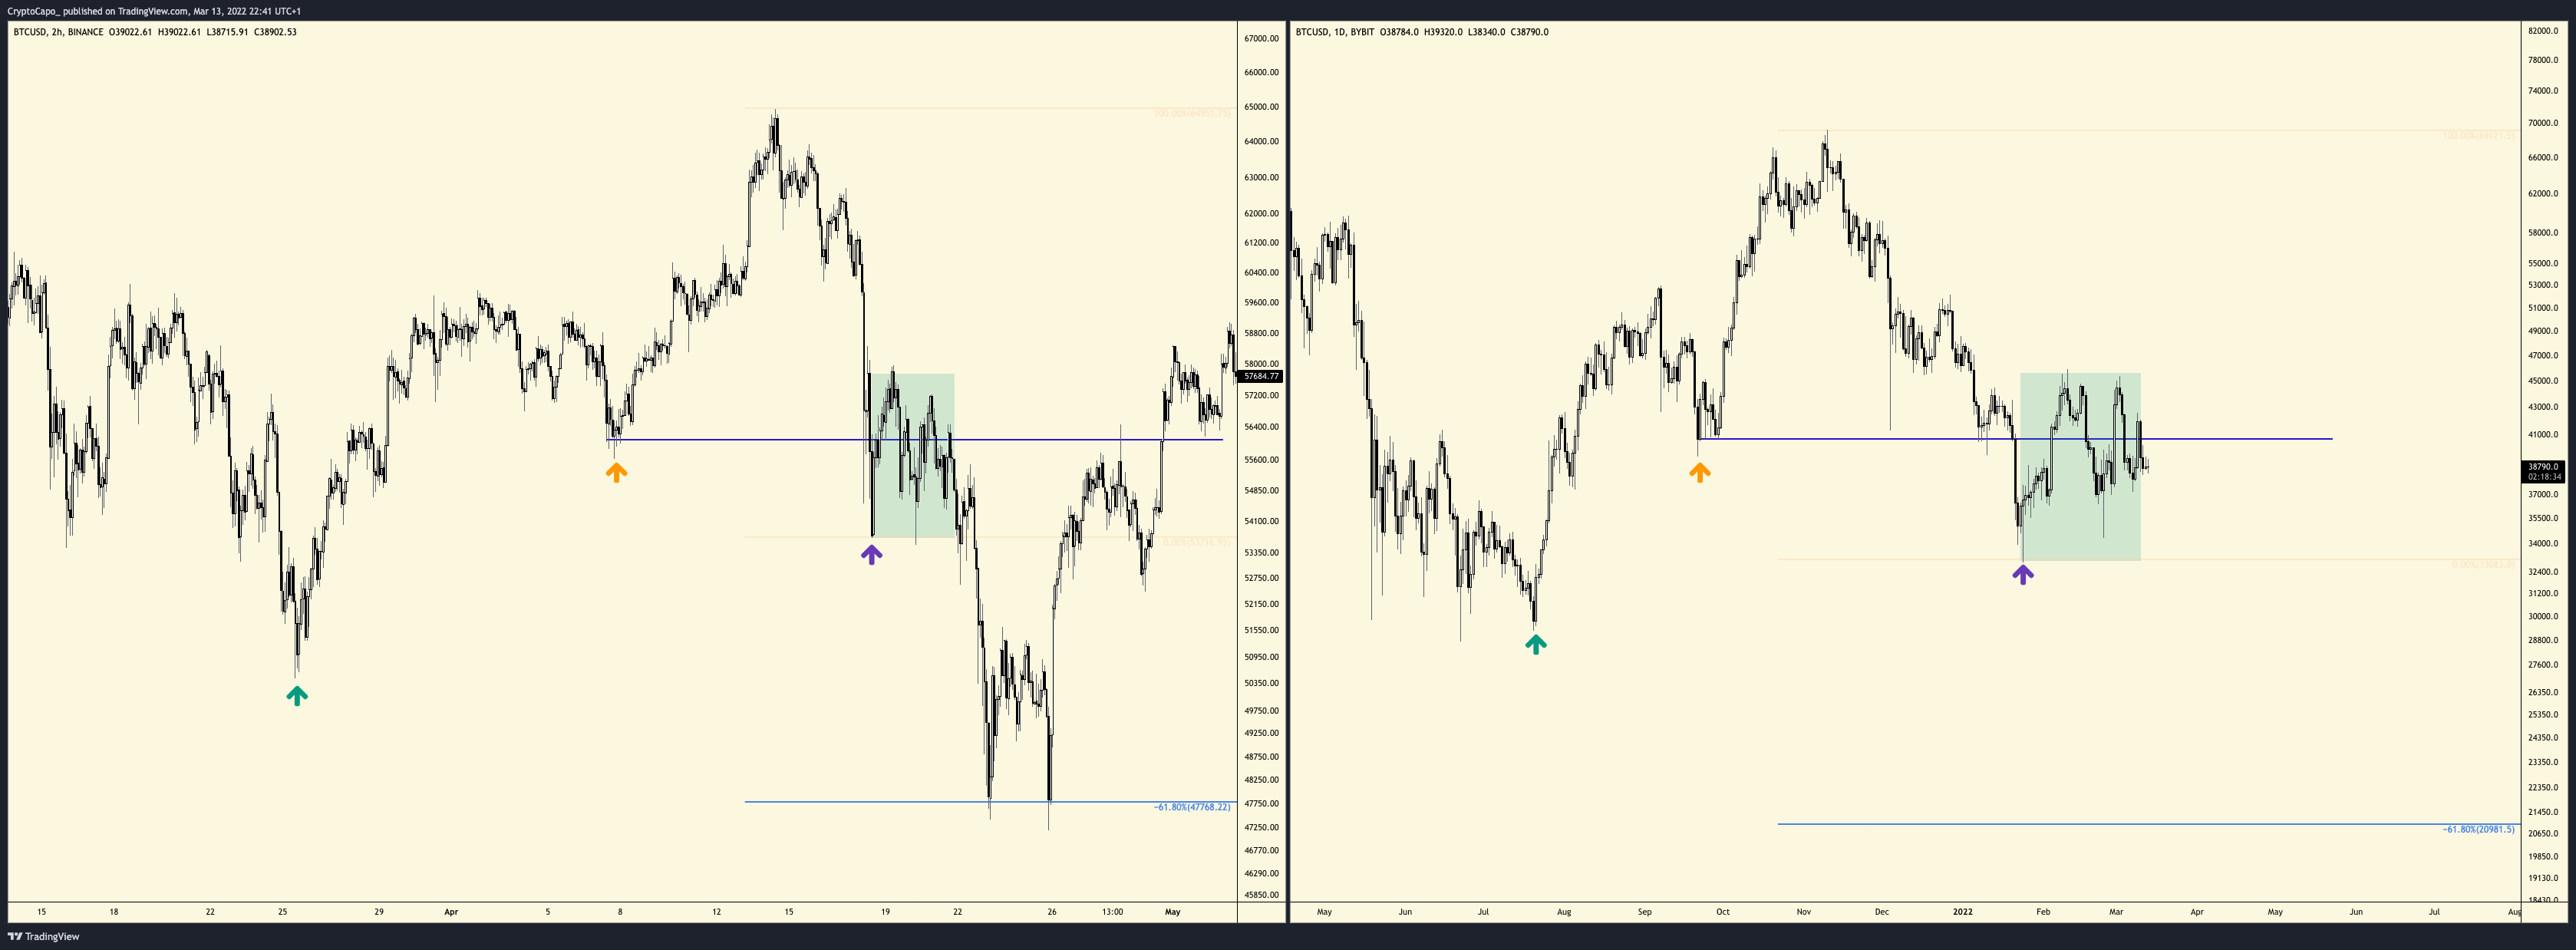
He notes that the BTC market is showing a similar pattern as it did during the massive correction of May 2021. Capo adds that February's relief rally and the successive price action is evocative of the period before when the market nosedived, starting May last year and eventually pitting bottom below $30k in July.
 BTC/USD trading chart
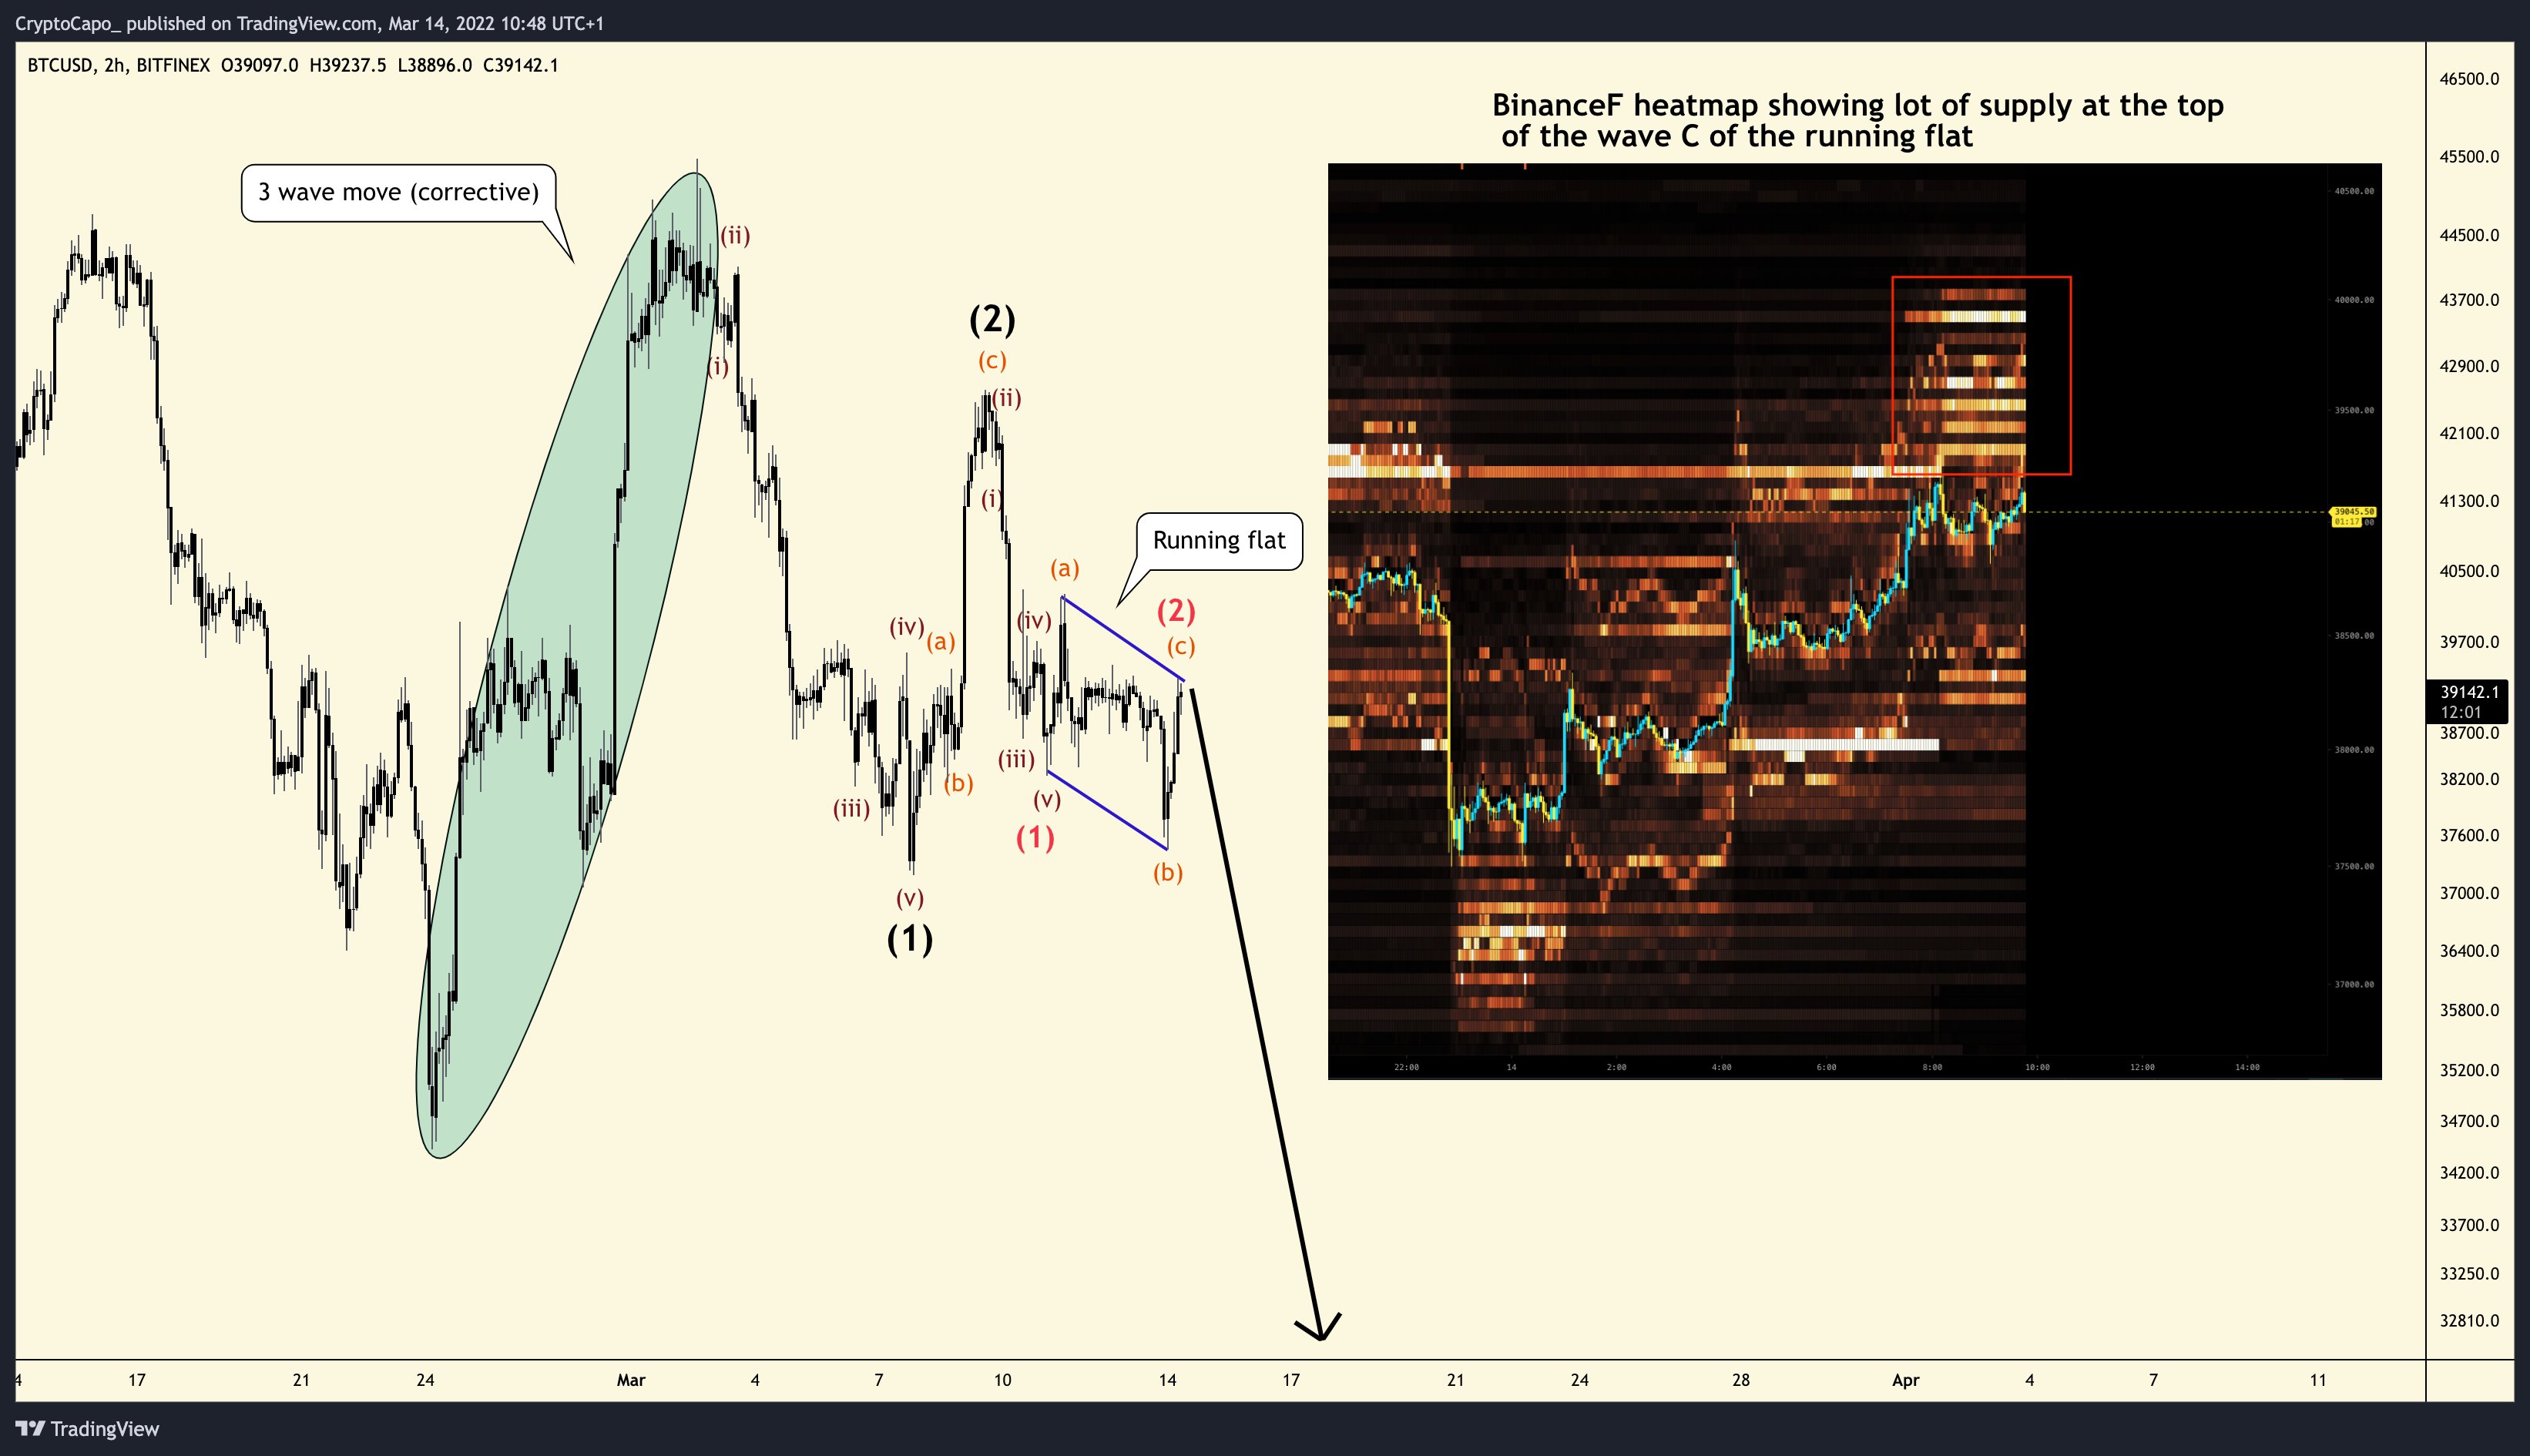
A more recent update from the crypto analyst indicates that Bitcoin could correct closer to the $21k to 23k range. He explains that such is the case because BTC is currently charting a declining 1-2 1-2 pattern which could mean a longer third wave (corrective) and thus likely achieves his set bear targets.
 BTC/USD trading chart
LUNA could chart lows in the $40 zone
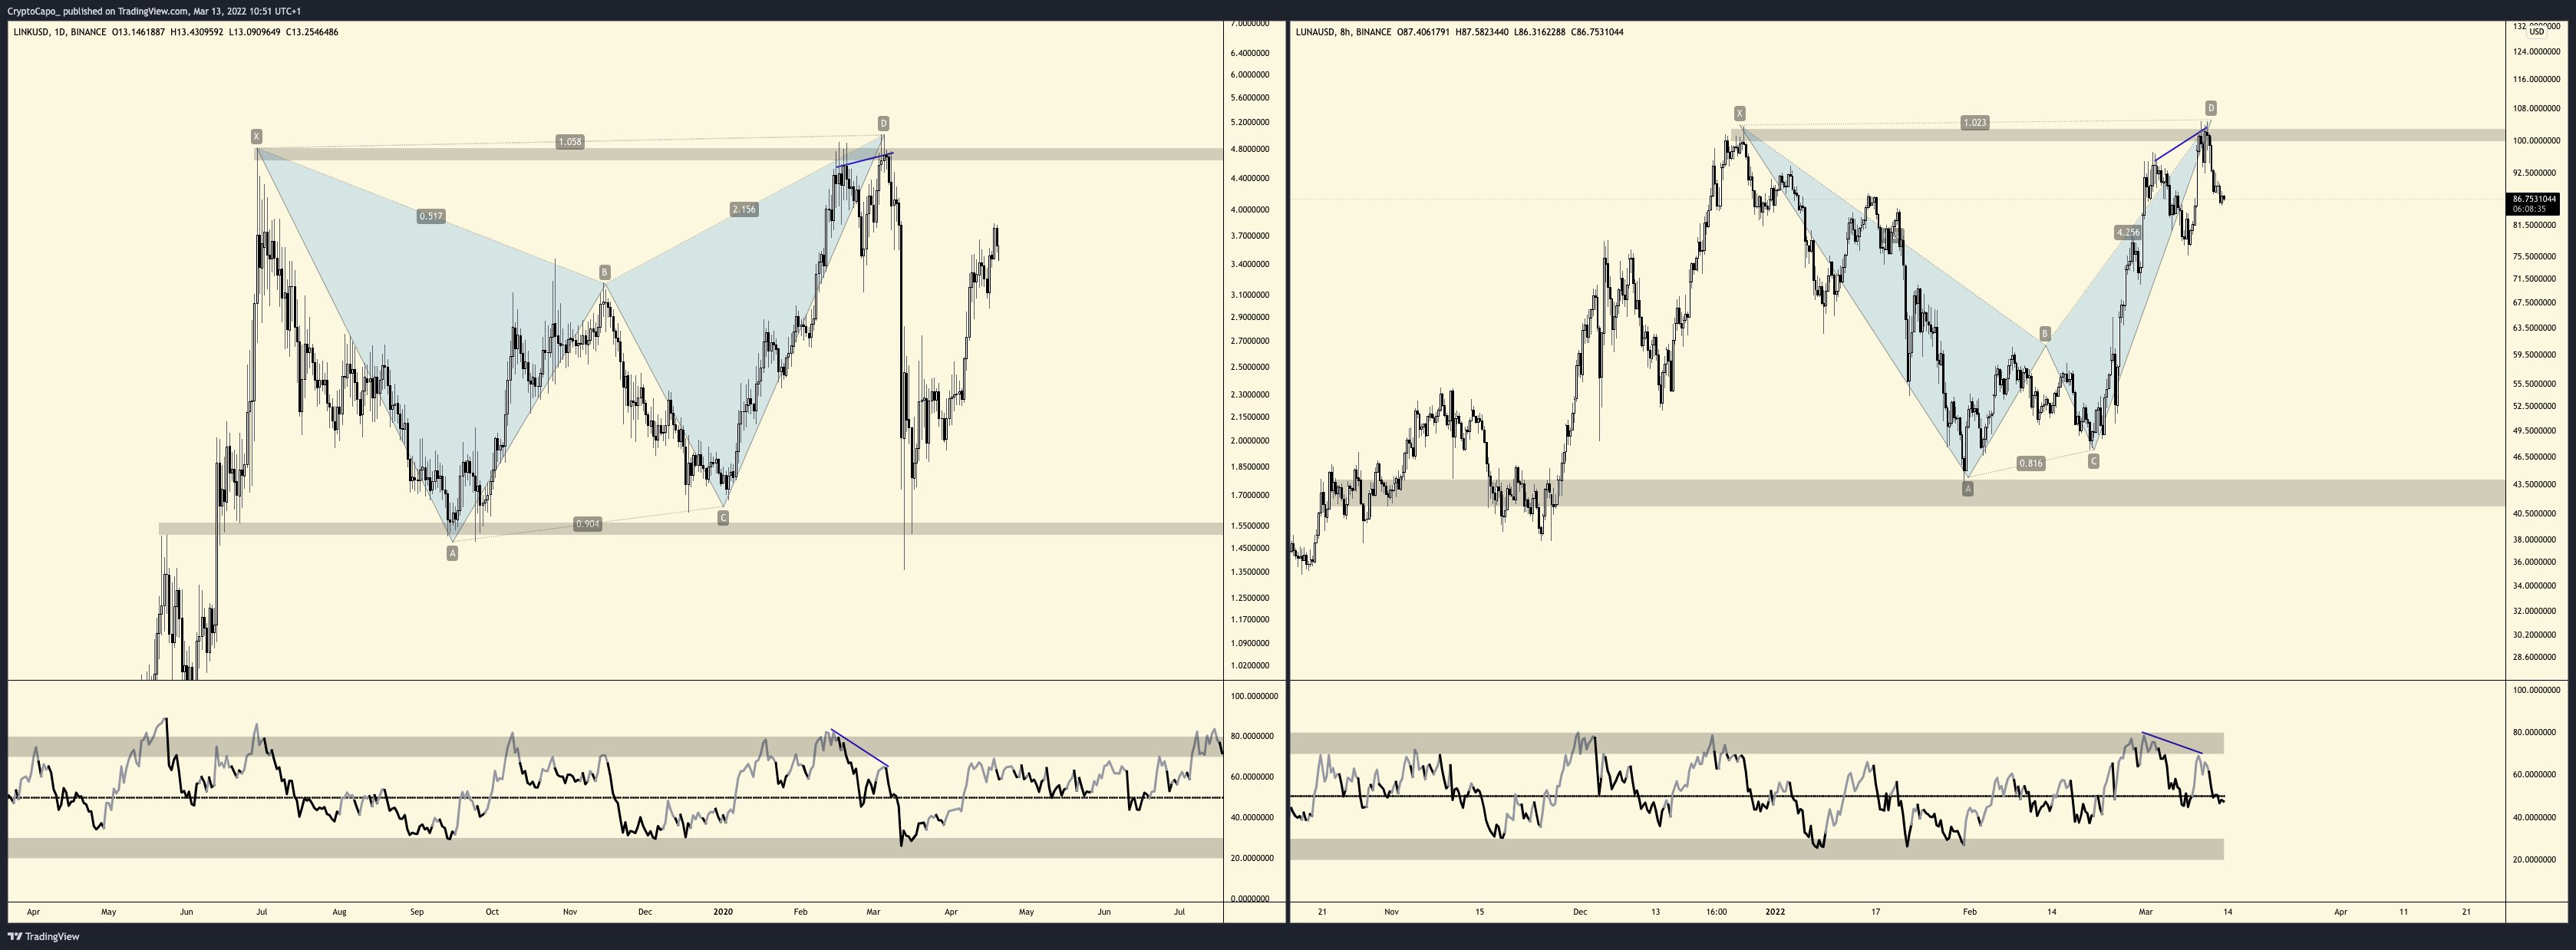
The pseudonymous crypto strategist has also observed a similar pattern between Terra's LUNA current market behaviour and that of decentralised oracle network Chainlink's LINK token in its last major correction.
 LINK/USD trading chart vs LUNA/USD trading chart
Capo observed that the two tokens have been performing quite identically throughout the recent bear market. He, therefore, feels that by modelling such a path and having confirmed the regular bearish divergence, LUNA could fall towards the $40 to $45 region.
"LINK vs. LUNA. They have been performing very similar while the entire market was down. Expecting LUNA to go to the lows of the range ($40-45) after confirming the regular bearish divergence."
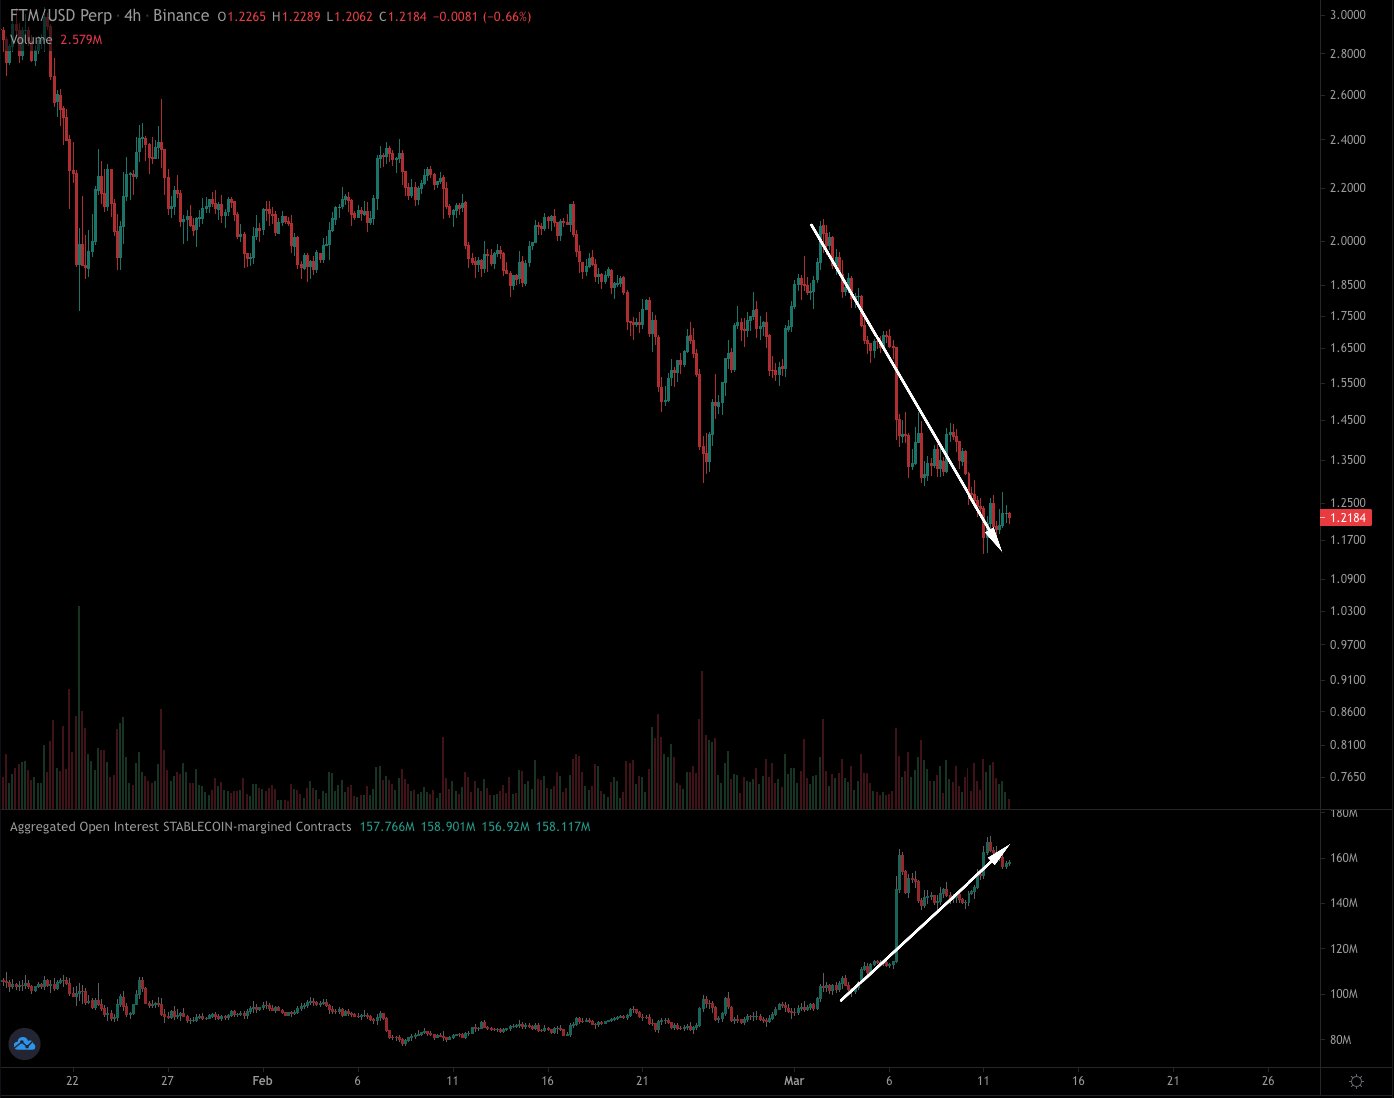
The high open interest in Fantom is indicative of a further price downturn
FTM, the native token of open-source, decentralised smart contract platform for dApps Fantom, is similarly in danger of downside risk.
 FTM/USD trading chart
Capo explained that the immense increase in open interest as FTM's price plummets further indicates an aggressive attempt by investors to short the token – evidence that they expect it to seek even lower prices.
"FTM. Something you don't want to see during a bearish trend. This looks so bad, to be honest."

