Cardano bulls are targeting an uptrend to recent highs near the psychological price level of $1.00
Cardano’s price is looking to break above $0.9000 after bulls recovered from extended downward action that had taken ADA to lows of $0.6862. Since its rebound to $0.7845, ADA price has recouped nearly 15% of its value against the US dollar.
At the time of writing, Cardano is trading around $0.8949 and looks set to correct higher given the strong bounce observed over the past few hours. A new push above the immediate hurdle at $0.9000 will allow bulls to target the recent peak and the psychological $1.00 level.
On the contrary, the technical picture suggests a break below $0.8200 could push prices $0.6800 or lower.
Cardano price outlook
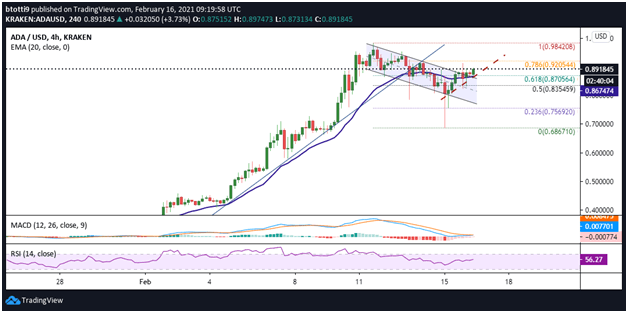
Cardano’s price is trading above the upper trend line of a declining parallel channel that has restricted movement over the past five days. The channel formation resulted from the rejection at $0.9820.
The breakout above the upper limit has added the likelihood of bulls strengthening in coming sessions. As seen on the 4-hour chart, ADA price has established support above the 20-day EMA ($0.8674) and the 0.618 Fibonacci retracement level of the downswing from $0.9820 high to $0.6862 low, which now acts as support at $0.8705.

There is a bullish trend line forming on the 4-hour chart, which could help keep the uptrend intact. The MACD is suggesting bulls are gaining momentum as bulls begin to weaken, while the 4-hour RSI is looking to extend above the 50 level.
This means that if bulls retain the upside advantage and break above $0.9000, they may only face one more hurdle at the 0.786 Fibonacci level ($0.9205) before hitting a new year-to-date peak.
Buyers need a clear break above this hurdle, which would then call for more buy orders and open up a run to the multi-month peak of $0.9820. The momentum picked above the $0.9900 barrier could then propel buyers past the coveted $1.00 level.

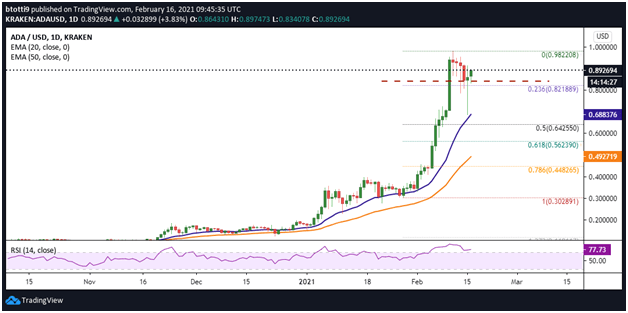
On the daily chart, ADA/USD is also trading higher. However, bulls face a strong challenge near $0.9000. If prices fail to clear this hurdle, the next flip would be to previous support at $0.8410. Beyond here, we could see ADA/USD decline to the 0.236 Fib level ($0.8218).
Any more losses beyond these levels could invite further sell-side pressure and ignite a downside correction to the major support level at $0.6884 (4-hour 20-EMA). The 50-day EMA provides another robust support zone at $0.4927.

