Cardano’s ADA rallied almost 120% this week to see highs of $0.98
Cardano (ADA) surged by nearly 120% this week as prices reached $0.98 level. This is the highest price level for the cryptocurrency since January 2018.
The momentum saw Cardano briefly surpass Tether (USDT) into the third spot among the largest cryptocurrencies by market cap. As of writing, ADA occupies the fourth spot, above 5th placed XRP.
ADA is trading near $0.90, about 2% down on the day as sellers step in amid profit booking.
But even with the selling pressure, Cardano remains in a bullish mood. If bulls take the initiative going into the weekend, upward action could see the cryptocurrency’s price move towards the all-time high of $1.33—also reached in January 2018.
On the other hand, if bears continue to trim the gains, ADA/USD could see lows of $0.83—$0.80 over the week.
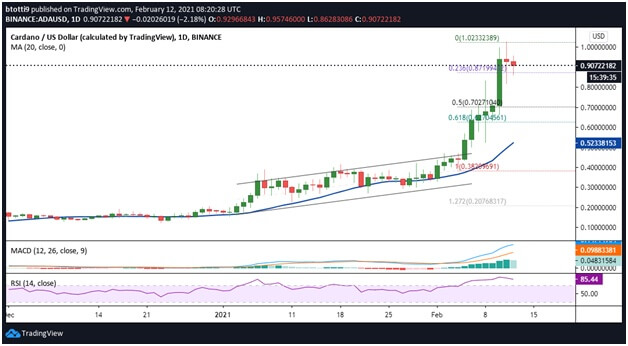
Cardano price daily chart
Cardano’s historic breakout after staying in consolidation for over two years came after a break above the upper boundary of a parallel channel. Cutting above $0.64 level, which was a critical support/resistance zone during the last bull cycle, also strengthened the uptrend as bulls rallied to $0.90 and then the $0.98 high.
Looking at the daily chart, we see the RSI is in overbought territory but not overextended, while the MACD is in the bullish zone. These are signals that bulls retain the advantage right now.

ADA/USD daily chart. Source: TradingView
If buyers take the dip as a buying opportunity, a forceful rebound to the $0.935 level could inform another leap towards $1.00. The next target could be $1.22 and then the ATH at $1.33.
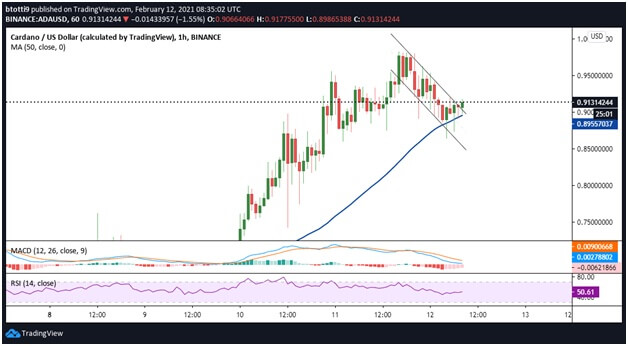
Cardano price hourly outlook
ADA/USD remains largely bullish in the short term, with the RSI above the midpoint, while the MACD suggests a hidden bullish divergence.
However, that perspective could change if support at $0.90 flips. In this case, the first support level is at $0.87 (0.236 Fib). A lack of support levels up to $0.83—$0.80 region means the next downside target could be $0.70 (0.5 Fib). Beyond this, near-term targets lie at $0.627 (0.618 Fib) and the 20-day SMA ($0.523).

ADA/USD hourly chart. Source: TradingView
Currently, ADA/USD is above the upper boundary of a descending parallel channel formed on the hourly chart. This follows the correction to the $0.90 support zone.

