ChainLink price could break towards $30 if price action maintains its upward trajectory from the weekend
The price of LINK, the native crypto token on the decentralized oracle protocol, had retreated nearly 8% since touching an all-time high of $26.90 on 5 February 2021.
Developer activity
The cryptocurrency’s price has, however, moved above $25 and remains in sight of the all time high as a strong bullish case unfolds amid increased development activity.
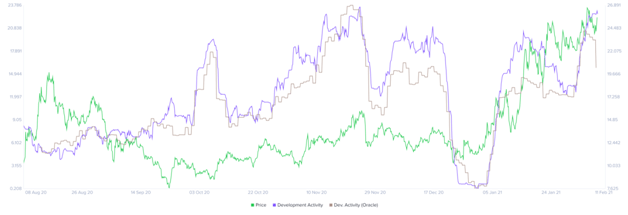
According to data from the on-chain analytics platform Santiment, the past week has seen development activity on the decentralised oracles platform surge significantly. Notable to investors is that such spikes in dev activity in the past has preceded price rallies for the token.
In this case, bulls will likely take advantage and push prices to a new all-time high. The technical picture suggests the rally could see LINK/USD surpass $30 short term.

ChainLink development activity and price chart. Source: Santiment
LINK price
ChainLink (LINK) could break higher and target a new high above its current record just under $27.
One analyst has pointed out that LINK staying above $23 is the signal that the token is primed for further growth. The bullish picture is strengthened by the lack of any major barriers above $25 as shown by IntotheBlock’s IOMAP price map.
“Everything isn’t over yet for #Chainlink. The TD presented a buy signal on the 1hr chart, and on the 4hr chart, $LINK seems primed to rebound from the triangle’s hypotenuse. @intotheblock’s IOMAP suggests that as long as #LINK holds above $23.10 the bullish outlook will prevail.”
The above outlook appears to be playing out for LINK/USD as buyers have moved above $24 and are currently looking to strengthen above $25.
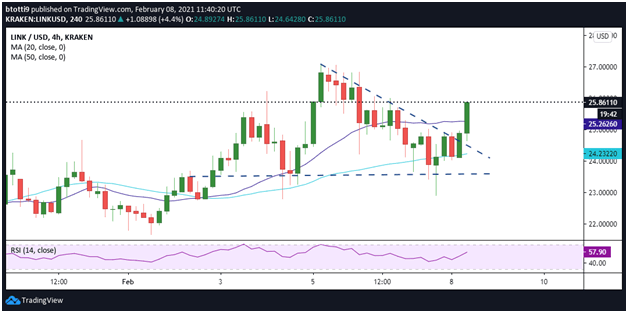
As of writing, buyers are looking to break above $26, which means a daily close near or above, intraday highs of $25.84 will reinforce this positive view. This will allow buyers to focus on the all-time high with the immediate target as the price hits discovery mode being $32.65. This level corresponds to the height of the descending triangle.

LINK.USD 4-hour price chart. Source: TradingView
Positive for bulls is also the fact that LINK price is sitting on major support at the 20-SMA ($25.26) and 50-SMA ($24.23).
However, this will likely turn negative if there is a succession of lower highs on the 4-hour log. A candlestick close beneath the moving averages on the timeframe could aid bearish pressure towards $23. If bulls fail to hold prices at the old triangle’s horizontal line, a dip to lows of $20 could open up a leg down to support at $18.
At the time of writing, LINK/USD is trading at $25.86, with its daily candlestick over 4% in the green zone in the past 24 hours.

