Compound (COMP) bulls need to surmount seller congestion around $140 to maintain the upward trajectory
Compound needs to break above a major resistance area if bulls are to continue on an uptrend that could see them retest the $160 price level.
However, the last several hours have seen sellers’ refusal to cede ground restrict action below $140. If bears take control short term, Compound’s price could drop to the 50-SMA (daily chart).
COMP/USD technical outlook
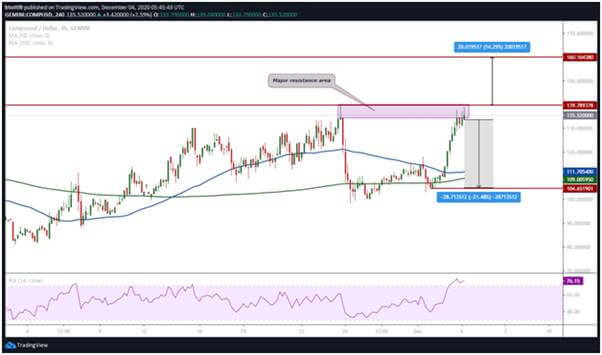
While bulls might have enough support to charge 14% towards $160, the technical outlook suggests sell-off pressure in the next few days could see a pullback to lows of $109 or lower. If that happens, the likely correction would set COMP/USD back by about 21% from the current price levels.
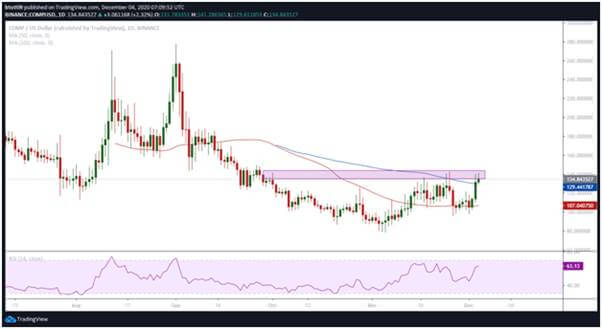
The daily chart suggests bulls are finding it difficult to break above the same resistance area that capped the uptrend in November. The subsequent decline saw COMP dip to prices below $100. The current technical outlook suggests a similar correction if bulls fail to clear the hurdle.
 COMP/USD daily chart. Source: TradingView
The 100-SMA ($127) offers support in case of a downturn in bulls’ fortunes, with a further cushion at the 50-SMA around $107.
A higher close on the daily and weekly time frame, above the primary resistance level, should see bulls rally to $150. Extended gains amid a broader uptick in DeFi sentiment could then help bulls target $160 and then the 90-day high around $197.
 COMP/USD 4-hour chart. Source: TradingView
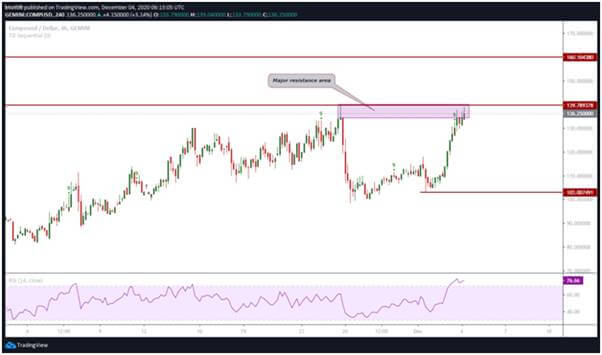
However, as shown on the 4-hour chart above, bears are likely to stay put near the highlighted resistance level short term. One indicator that suggests a bearish trend is likely is the RSI, which is trending in the overbought region. A flip in the metric could see prices decline, as is suggested by the TD Sequential that recently printed a sell signal.
The last time the TD Sequential printed a green nine candlestick on the 4-hour time frame, validation saw prices correct to lows of $103.
 COMP/USD 4-hour price chart. Source: TradingView
If the latest sell signal validates and bulls fail to clear the highlighted hurdle, COMP/USD could correct to $120. Beyond this level, further losses could see bulls look to the main support levels around the 50-SMA ($111) and then at the 200-SMA ($109).
At the time of writing, Compound is trading around $136, about 10% in the green over the past 24 hours. The token is outperforming other top 10 DeFi tokens, with Aave (AAVE) posting the next best 24-hour performance currently at +6.5%.

