ATOM/USD drops nearly 9% after surging to highs of $8.86
Cosmos rallied over 35% on Tuesday to climb the crypto charts as one of the best performing altcoins in the market.
While the cryptocurrency, which is ranked 17th largest by market cap, retains the upside potential, the correction suggests sellers are intent on more pressure around $7.50.
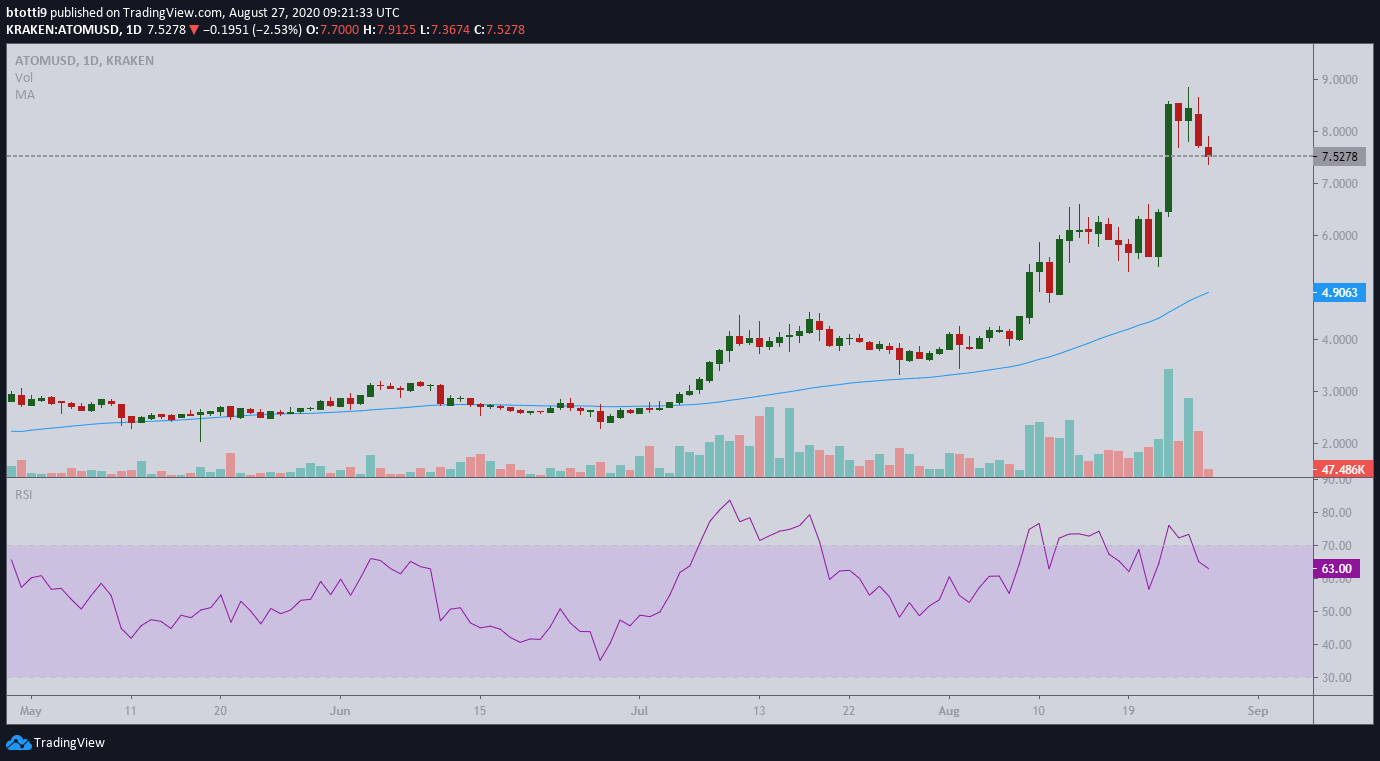
ATOM/USD rallied to a high of $8.86 before the rollercoaster ended with a snapshot after sell-off pressure saw it plunge nearly 9% in the past 24 hours. ATOM/USD is 22.56% in the green over the past seven days and traded as high as 50% up in the past 72 hours after price surged to highs of $8.86.
What aided Cosmos price is an uptick in decentralized finance protocols. Tokens like Band Protocol and Kava have surged in the past few days to suggest some of the gains spilled over to Cosmos. But with the market looking to post an overall leg up, ATOM/USD seems to be stalling.
As of writing, the pair is trading around $7.51, to suggest the downturn could be driven by increased profit-taking deals.
ATOM/USD: The technical outlook

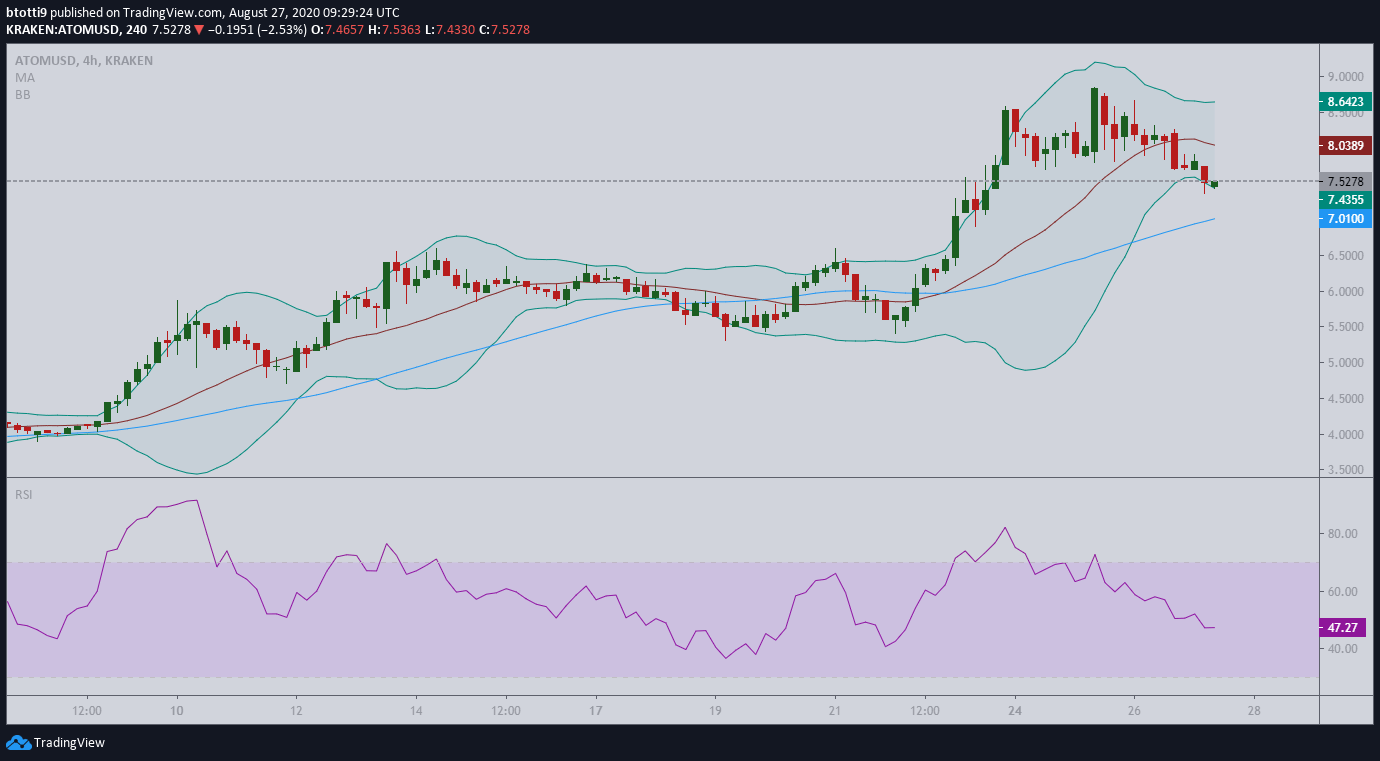
The ATOM/USD price has reversed from its local highs and has in the past hour printed a series of higher lows and lower highs on the 4-hour chart.
If sellers do not relent in their pressure, the pair could retreat to the local support area around $7.01 as suggested by the SMA 50 on the 4-hour chart. The price is also hugging the lower limit of the Bollinger bands on the short term timeframe to suggest a dip to $7.00 is possible if price breaches the boundary.

Cosmos price has also broken below the SMA 50 on the hourly chart, and the RSI is slopping at 47.27 to suggest a bearish trend unless bulls retake control short term.
If the price falls below the Bollinger bands lower limit, a daily close below $7.00 could return ATOM/USD to support levels around $6.50 SMA 200 on the hourly chart. The SMA 50 on the daily chart prints a support zone around $4.906.
A return to upside action could see bulls revisit resistance around $8.00 and above that, aim for the critical $9.00.

