Decred’s (DCR) spike of more than 50% saw bulls rally from $26 to see highs of $42 and the token could target higher levels short term
Decred price rallied to highs of $42 after surging more than 50% in 24 hours. Although the token has since bounced off the highs, broader crypto market sentiment and a confluence of technical indicators suggest bulls could still push higher in the short term.
At the time of writing, DCR price is around $33, which puts it 38% and 57% up against the US dollar in the past 24 hours and seven days respectively.
According to on-chain data provider Santiment, DCR price touched a 13-month price level, the surge coming amid a spike in trading volume. It also follows Decred co-founder and project lead Jake Yocom-Piatt’s appearance on Nasdaq’s TradeTalks where the discussion focused on blockchain and its potential use in elections.
DCR/USD price outlook
According to one analyst, Decred’s upsurge followed a confluence of bullish technical indicators formed over the past few days. The DCR bull forecast buying pressure would drive prices higher based on the token’s realised price, Market-Value-to-Realized-Value (MVRV) Ratio and Mayer Multiple.
The analyst tweeted just before the spike:
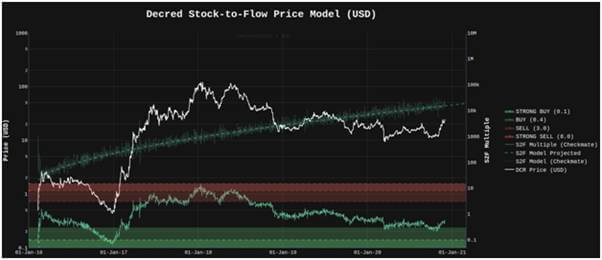
“Decred is breaking out again. Quick overview of some charts and potential short term targets. Now firmly above the realised price. This is a bull market folks. MVRV upper band with 20% probability of mean reversion is $34 and trending higher. Mayer multiple 5% prob is $42. Ye Olde Stock-Te-Flow model calls for around $44”.
 DCR stock-to-flow price model suggests breakout to $44. Source: Checkmate on Twitter
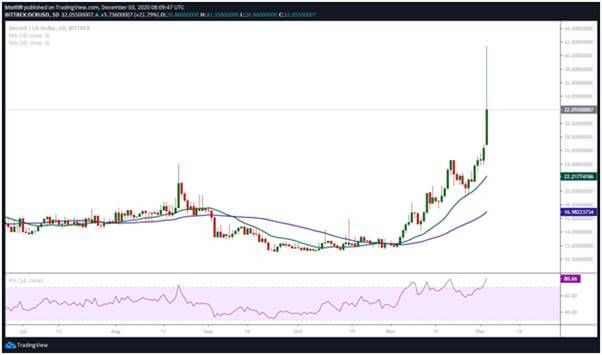
On the daily chart, the RSI and MACD indicators suggest bulls are in command and a higher candle close would provide the base for another leg up.
Currently, bulls are looking to keep prices above $30 to retain the upper hand. Action in the past few hours has seen buyers battle strong resistance at the 50% Fibonacci retracement level ($33.94).
Above this level, bulls will need to breach the demand wall at $35.64 (61.8% Fib level) to open up a path to a higher daily close. From here, bulls can target a retest of intraday highs near $42.
 Decred price daily chart. Source: TradingView
On the downside, the daily chart suggests a dip to the upper trendline of a parallel ascending channel that has restricted action since 13 November.
A breakdown below this level could see DCR/USD retreat to lows of $25 (lower boundary of the channel). The upsloping 20-SMA ($22.20) and then the 50-SMA level ($16.98) provide further support levels.

