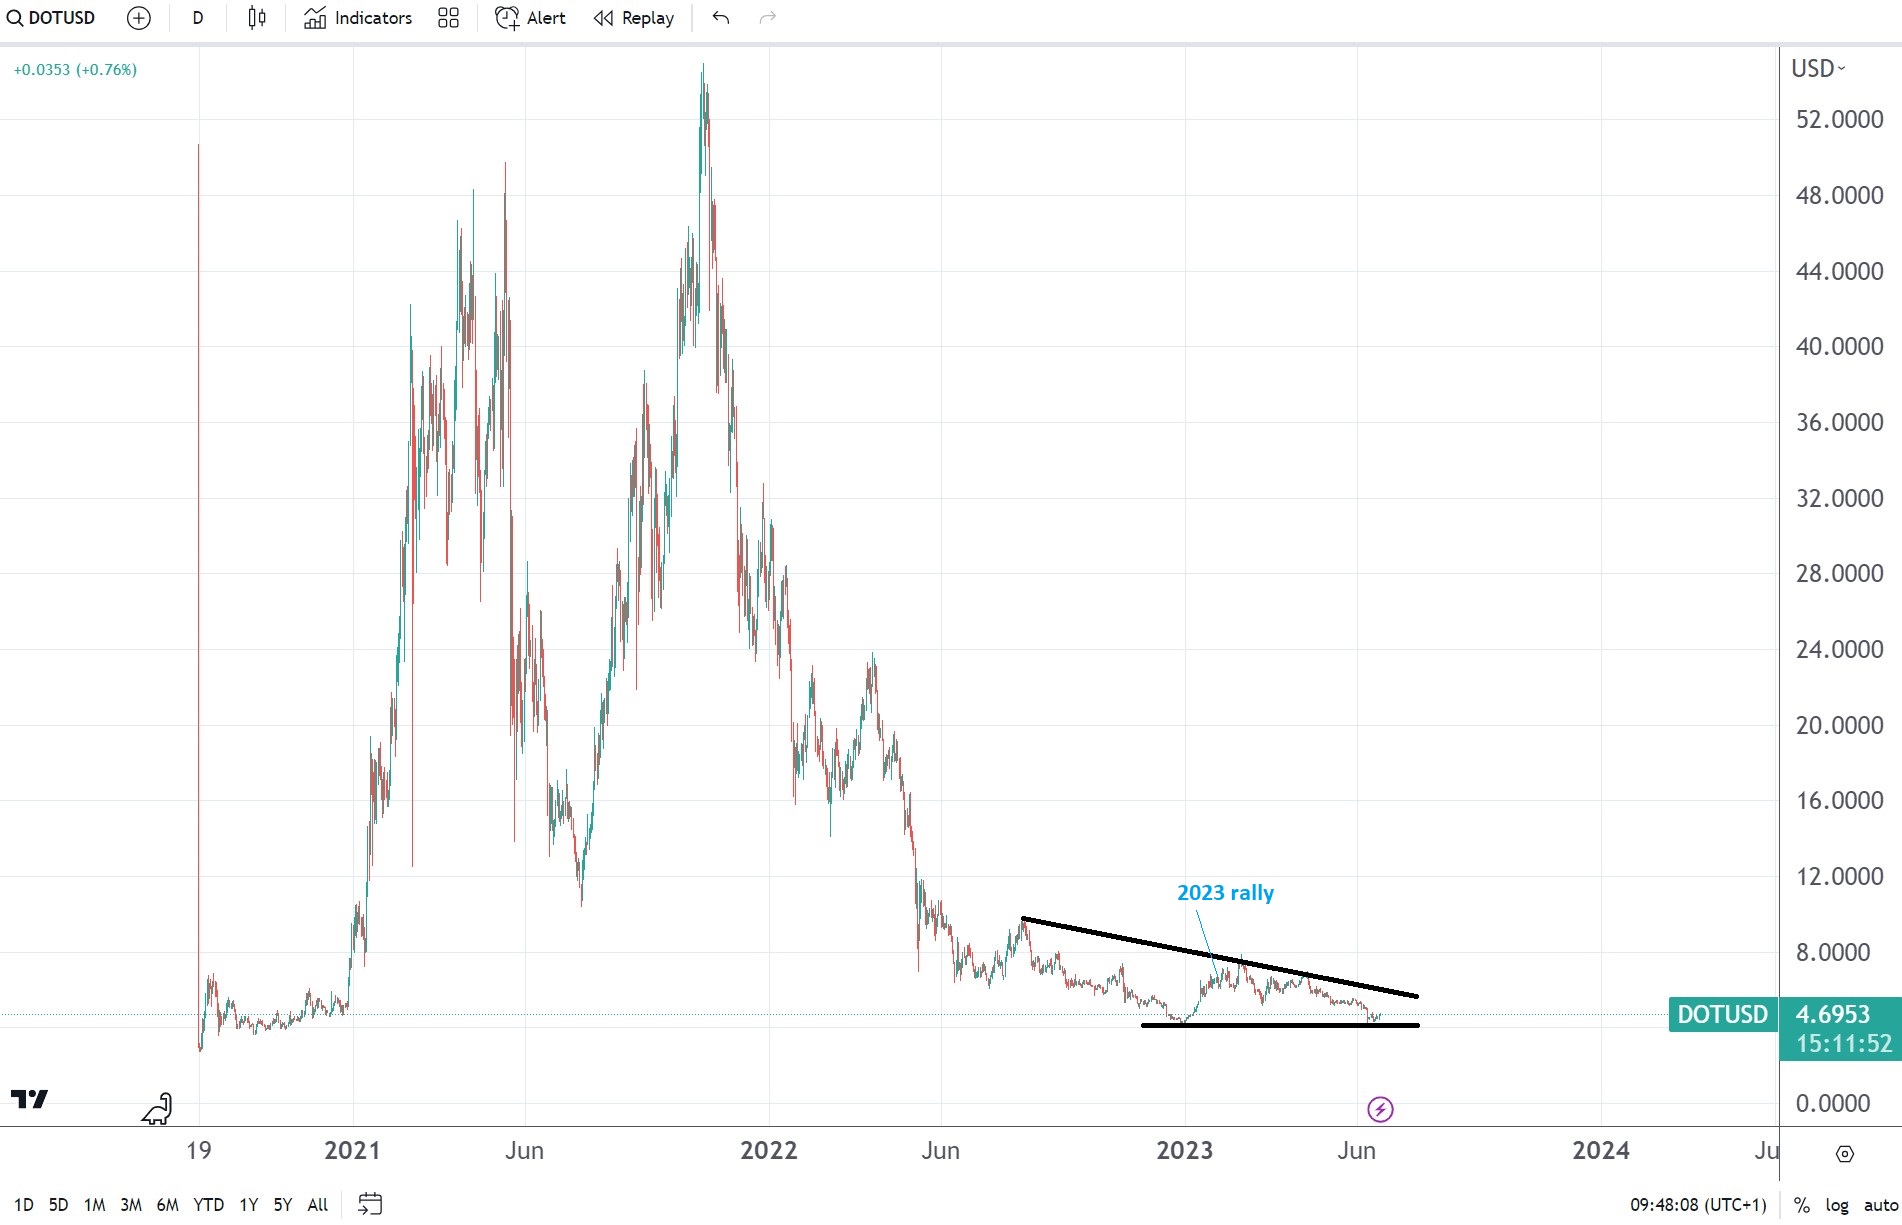
- Polkadot made a new low for the year
- All 2023 gains are gone as bears keep selling DOT/USD
- If Jerome Powell delivers a hawkish speech today, a descending triangle points to further downside for the DOT/USD pair
The cryptocurrency market rallied at the start of the year. Following a bearish 2022, investors saw the start of the new year as the beginning of a new bull market.
Bitcoin led, and other cryptocurrencies followed. But not all coins managed to close near their yearly highs.
For example, Polkadot made a new low for the year. More precisely, the DOT/USD pair gave back all of its 2023 gains, and things do not look good for investors.
That is particularly true ahead of the Fed’s Chair Jerome Powell’s testimony due today. He will testify about the semi-annual monetary policy report in front of the Senate Banking Committee in Washington, D.C., later today, and markets are eager to find out what he’s going to say about the future funds rate.
Any hawkish commentary should send the U.S. dollar higher across the board. Not only fiat currencies will react – but the crypto ones too.
Coupled with the technical analysis picture, the bias is bearish, as pointed out by a descending triangle.

A descending triangle spells trouble for DOT/USD
A descending triangle is a bearish continuation pattern. Hence, the price action following the pattern should continue in the same direction as the main trend traveled.
The main trend is bearish, given the fact that DOT/USD dropped from above $52 at the peak of 2021 to the current $4.7.
To confirm the bearish pattern, the market should travel a distance equal to at least the longest segment of the triangle. Calculating it does not make sense, as it points to almost 0.
I’m not saying that Polkadot will go to 0. I do state that before buying cheap coins, one should be better off looking at the bigger picture and looking for the obvious on a chart. In this case, as 2023 gains are gone, bulls are trapped. Add the descending triangle, and the bias remains bearish, not bullish.

