- Polkadot hodlers are underwater
- A bullish scenario remains valid if the lows hold
- A move above $7 should lead to more gains
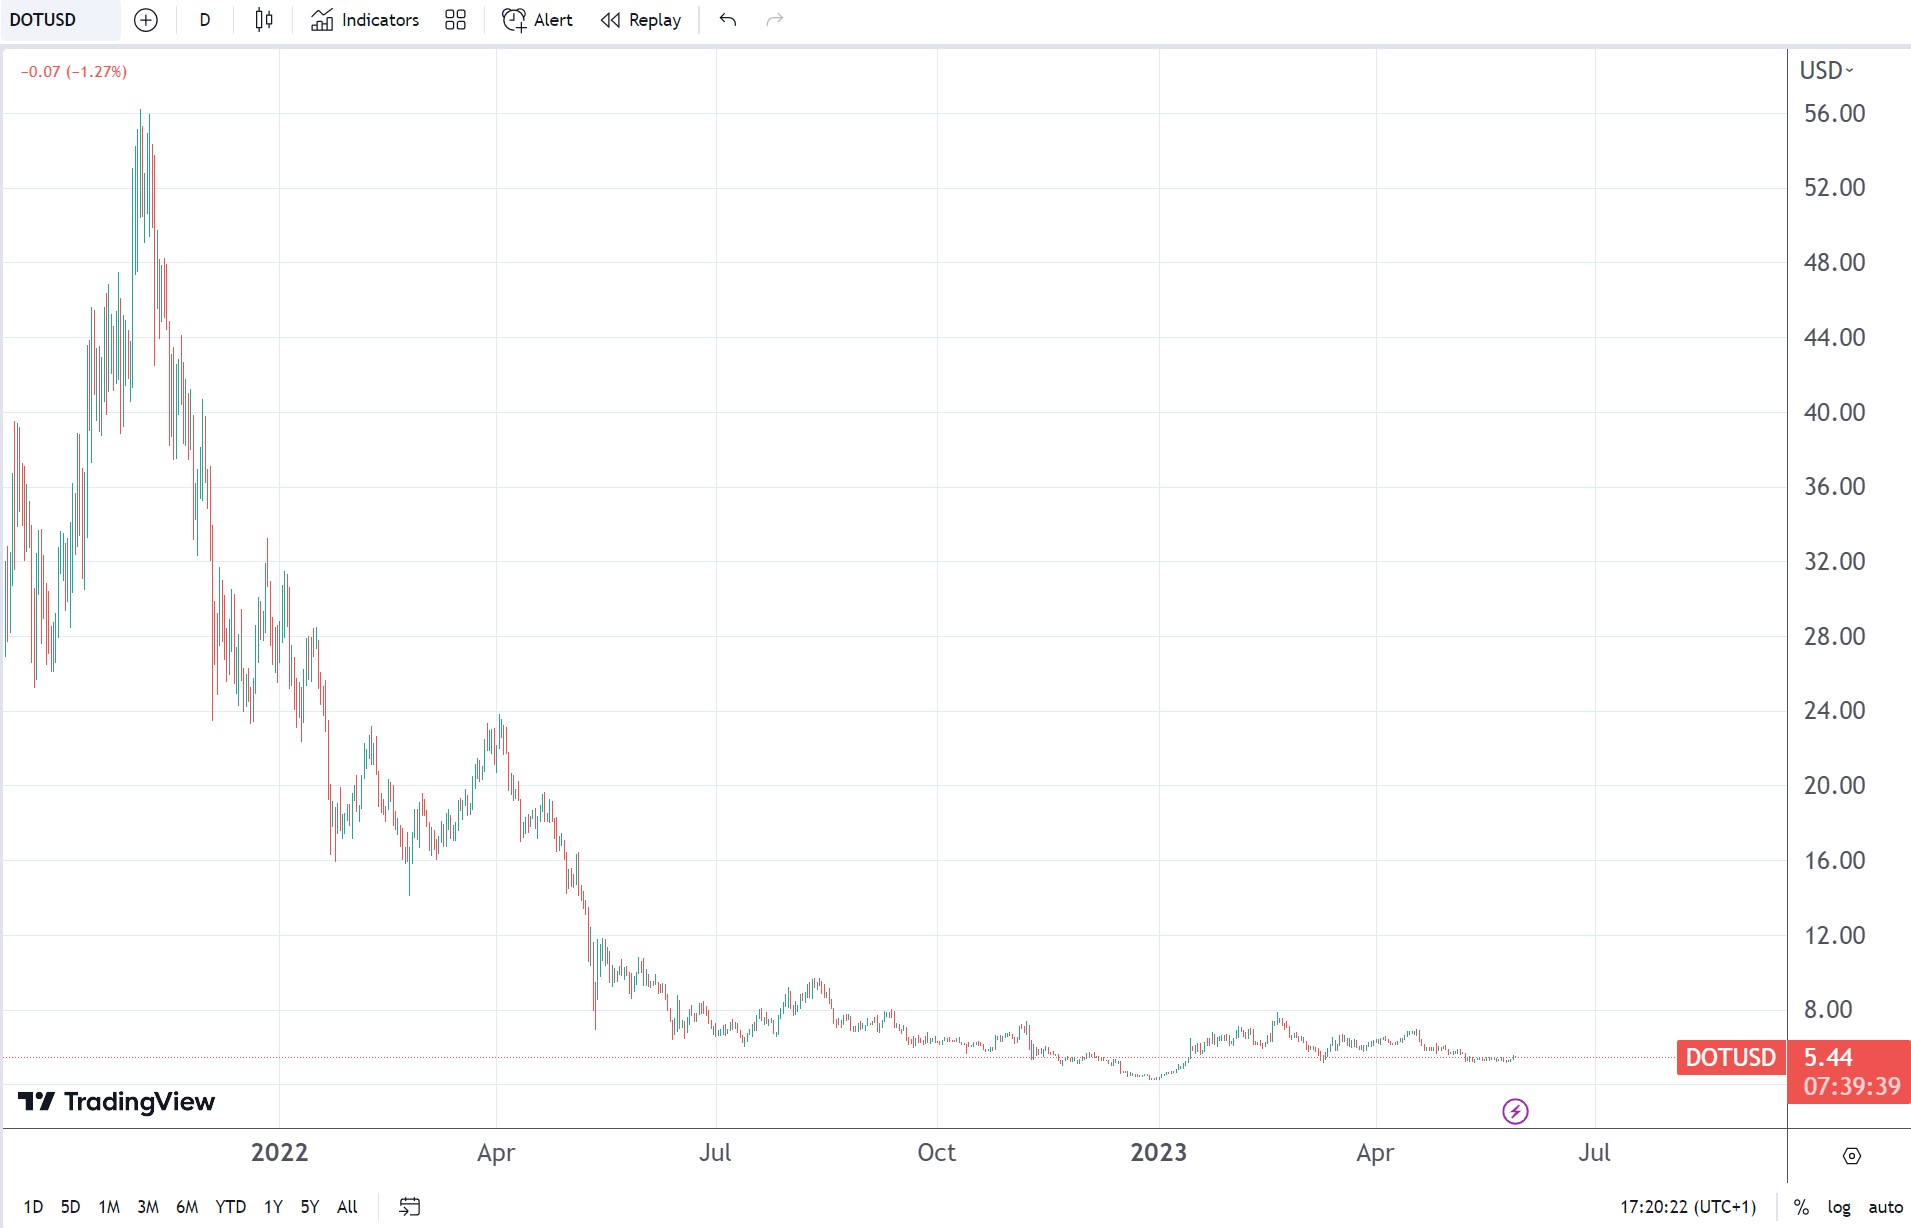
It has been a tough period for long-term holders of Polkadot. The DOT/USD exchange rate has moved South relentlessly after peaking at $56 in late 2021.
From $56 to $5, it was a straight decline. It took only one year for Polkadot to frustrate bulls.
And even now, as cryptocurrencies have rallied in 2023, one should be scared looking at the daily chart. After all, the bounce from the lows looks so small when interpreting the bigger picture that it is difficult to find a bullish argument.

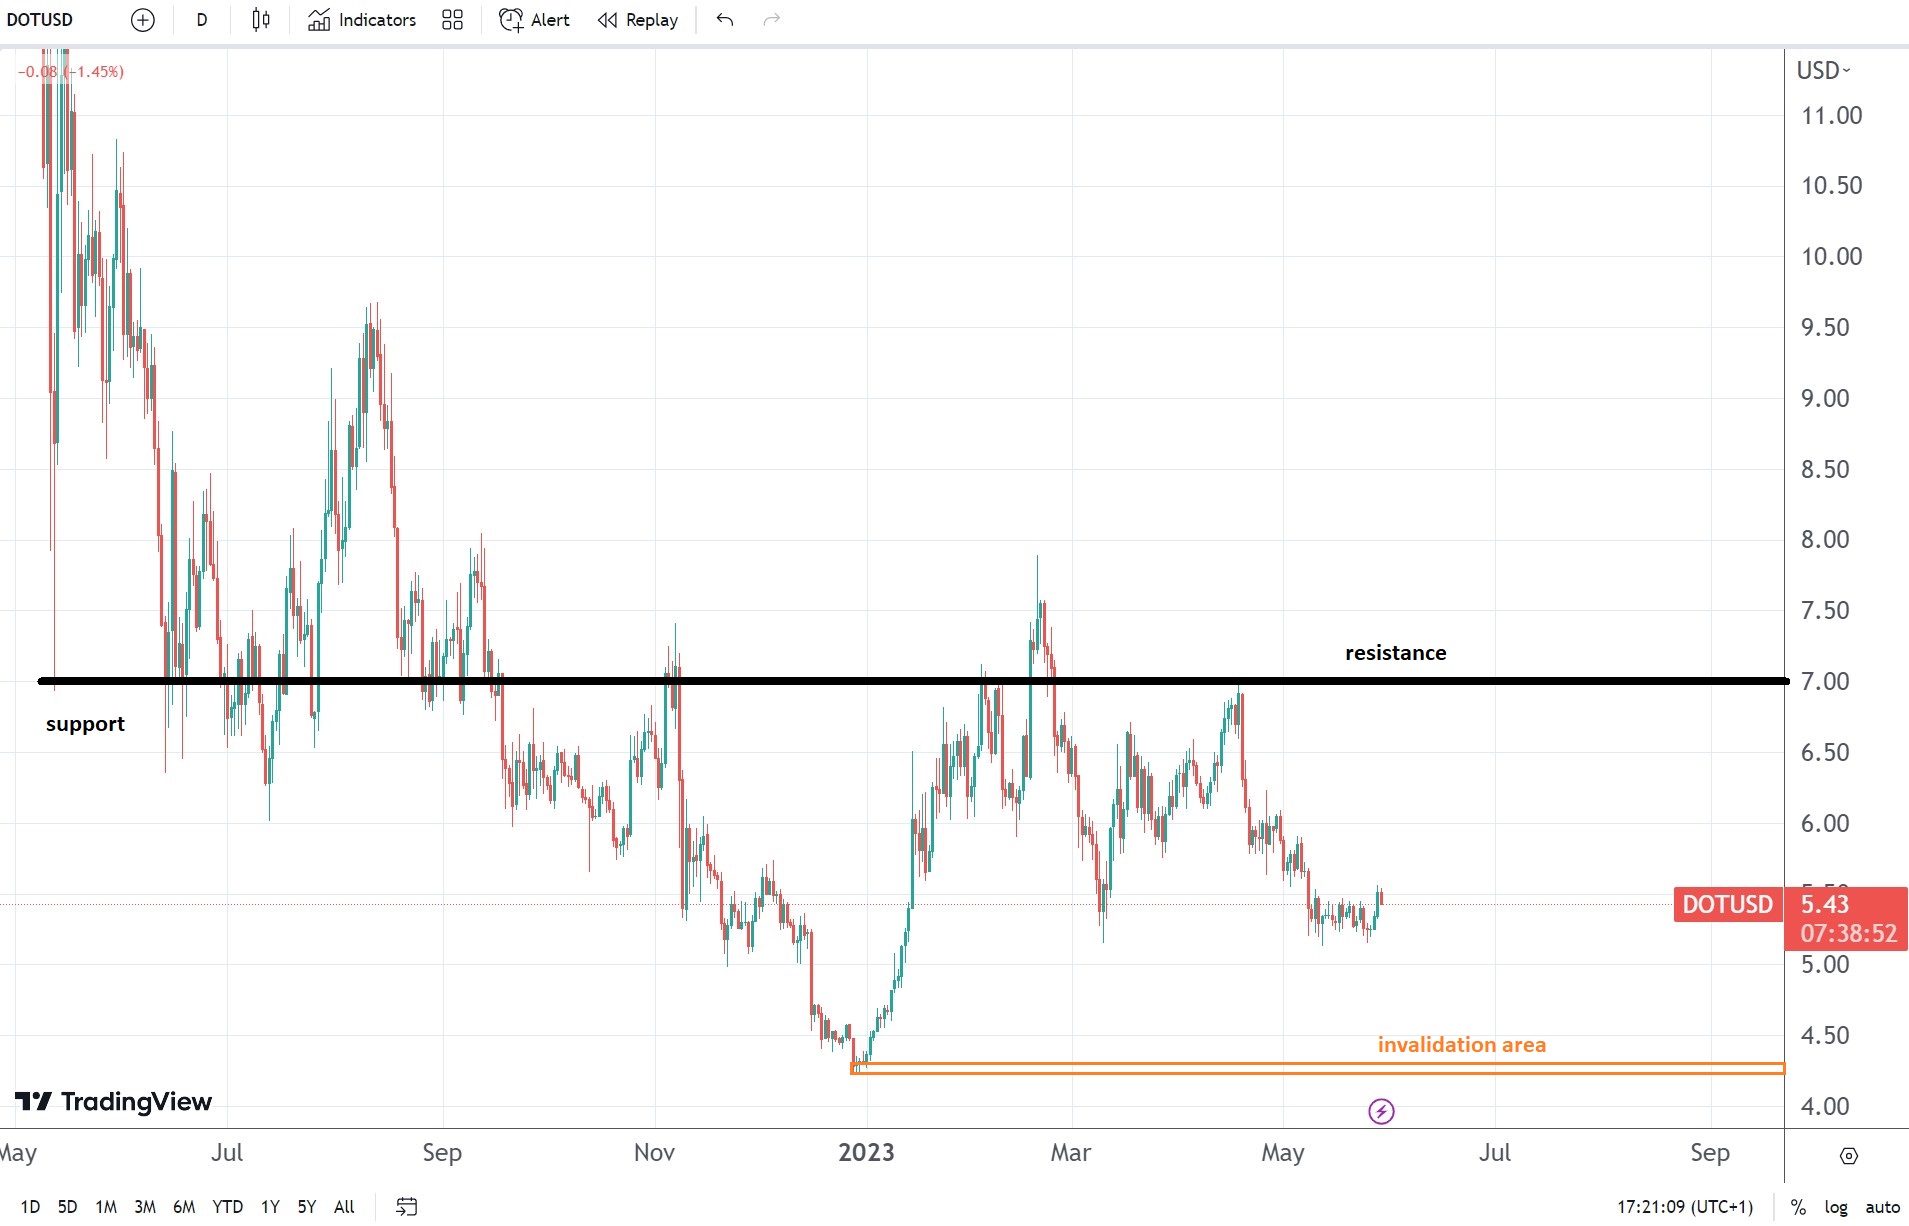
Polkadot should overcome $7 resistance area for bulls to be in control
Zooming in, one may see the 2023 rally that brought back optimism in the cryptocurrency market. Sure enough, Polkadot already gave back more than half of its YTD gains.
But the invalidation level for a bullish scenario still holds. Effectively, it means that the recent price action might be nothing but a correction part of a bigger-degree bullish trend.

The Elliott Waves theory states that an impulsive move (i.e., the one that began at the start of the year) is followed by a corrective structure, an a-b-c.
This a-b-c that corrects a bullish trend should have two waves moving in the opposite direction (i.e., waves a and c), and one that moves in the main trend’s direction.
It means that one may easily say that the move from the 2022 lows is an impulsive structure, and the decline from the 2023 highs is the a-b-c. In this case, the implications are bullish for Polkadot and bearish for the US dollar.
However, only a move above the pivotal $7 level would cement the bullish Elliott Waves scenario. Until then, bulls might wish for the price action to hold above the invalidation area shown on the chart above.

