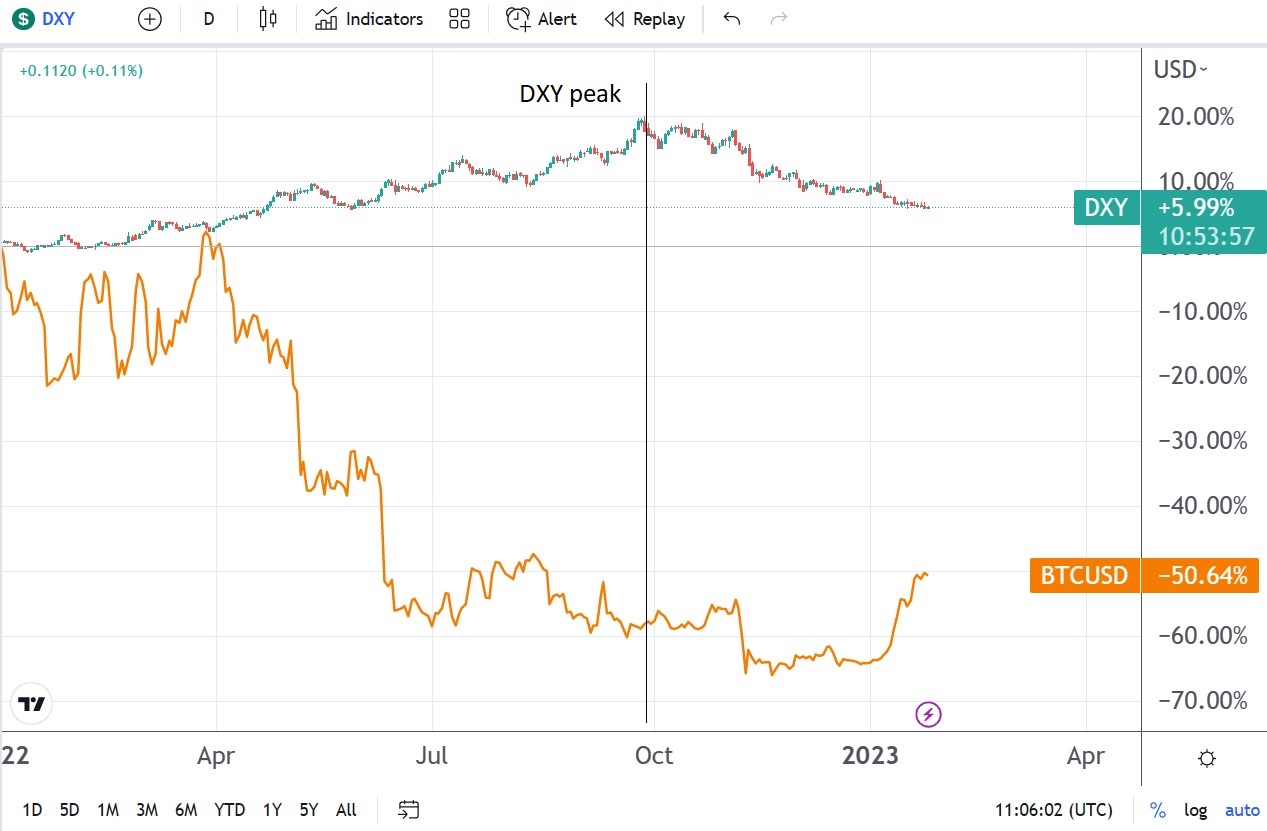
- DXY peaked at +20% in early October 2022
- BTC/USD bottomed at -75% in late 2023
- Lead-lag analysis suggests BTC/USD might see another +4% to close the gap
For years, cryptocurrency investors have had one big wish – Bitcoin, and other cryptocurrencies, to gain institutional adoption. In time, adoption came, but it changed the game’s rules for Bitcoin and other cryptocurrencies.
The more institutional investment into cryptocurrencies, the more the leading cryptocurrencies became correlated with the overall financial markets. Also, they started to react to economic data just as, say, the US dollar did, or the US stock market.
In other words, risk sentiment, on or off, dominates classic financial markets but also the cryptocurrency market. This is where we are today – so what happens next for cryptocurrencies? Where should Bitcoin go?
If the game’s rules have changed, one should look at different ways to evaluate the cryptocurrency market. One way is to interpret the Dollar index’s movement over the past year and compare it with BTC/USD. If the dollar was responsible for the late Bitcoin movements, should the dollar answer where Bitcoin goes next?
Lead-lag analysis suggests Bitcoin may rally some more
The US dollar rallied last year on the back of the Federal Reserve embarking on a tightening cycle. The interest rate on the main reserve currency has reached 4.5%, and still, investors are looking for at least another hike.
Therefore, the dollar’s rally in 2022 should not have surprised anyone. It was a general move higher, with the greenback gaining against all its peers.
Bitcoin could not have acted differently. Despite the general belief that Bitcoin should offer protection against inflation, it failed to do so, just like gold did.
So the dollar’s strength meant Bitcoin’s weakness. As such, it means that the dollar leads, so a close look at the dollar index (DXY) might help.

Focus on the chart above. It shows the DXY and the BTC/USD since the start of 2022.
While the DXY peaked at about +20%, Bitcoin fell by about -75%. The interesting part is that Bitcoin kept falling after the dollar peaked.
Therefore, the recent bounce from -75% to -50% puts Bitcoin just slightly above the level where the DXY peaked. Considering the recent weakness in the DXY, we might conclude that BTC/USD has more room to the upside (about 4%-5%) to catch up with the latest developments in the DXY.

