

IOTA/USD breaks above $1.20 as bulls seek recovery from sharp pullback to $0.88
An uptick in crypto sentiment has seen most altcoins looking to bounce off sharp corrections seen over the past week. Binance Coin, Polkadot, ChainLink and NEM have all posted notable gains, notching double-digit upsides in the past 48 hours.
IOTA bulls are targeting a similar move, which is likely given a rebound up from lows of $1.02 reached on 28 February. IOTA is trading at $1.90 against the US dollar, up by about 5% in the past 24 hours. The cryptocurrency’s price has broken out of a short-term descending wedge pattern to suggest a potential retest of prices near $1.40. Further gains could push prices towards $1.59.
IOTA/USD daily price chart analysis
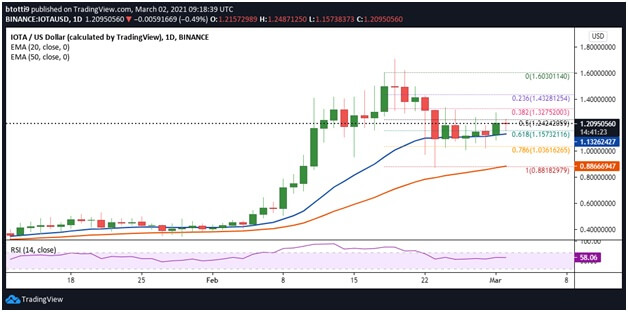
IOTA/USD is looking to stay above $1.10 after its sharp descent in the second half of February saw it dump from highs of $1.59 to lows of $0.88.
While the upside correction has staggered with multiple pullbacks, the technical outlook suggests buyers are likely to take command and push IOTA/USD towards the 19 February highs of $1.59.
The positive perspective on the daily chart is that bulls have kept prices above the 20-day EMA ($1.13). This has allowed them to build upside momentum, which could see them break above overhead resistance and target a higher close.
At the moment, buyers are looking to test resistance at the 0.5 Fibonacci retracement level at $1.24. If there’s a clear break above this supply wall, an upside flip could include taking prices past the 0.382 Fib level ($1.32) to the 0.236 Fib level ($1.43).
The bulls will likely battle a key horizontal barrier before they retest the $1.59 level.
As well as the positive curve of the 20-day EMA, the 50-day EMA ($0.88) is also rising. The RSI crucially remains above the middle line to suggest bulls have the upper hand.
IOTA/USD 4-hour price chart analysis
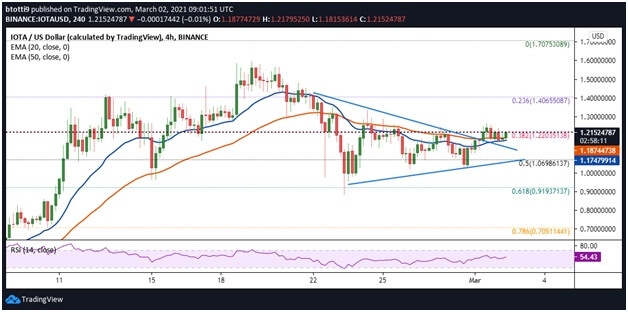
On the 4-hour chart, IOTA/USD is trading above the 20-day EMA ($1.17) and 50-day EMA ($1.18). The pair is also above a descending trend line that formed a previous wedge pattern.
Although the breakout from the pattern has not been explosive, a steady grind above immediate resistance at $1.23 (0.5 Fib level) could allow bulls to aim for $1.32 (0.382 Fib level). Above this, an increase in buying activity could push IOTA’s price towards $1.42 (0.236 Fib level) before another leg up brings recent highs of $1.59 into focus.
On the downside, IOTA/USD will turn negative if it breaks below the trend line support. This move could see extended sideways trading near $1.10, with failure to rebound attracting bears. If this scenario happens, sellers could target the $1.00 level and then recent lows at $0.88.