


Quant (QNT/USD) was at the centre of increased bull interest in the past one month. That saw the cryptocurrency top $220 earlier this month and return massively to investors. As CoinJournal reported, a range of fundamentals was behind the surge.
Quant currently trades at $177, in a market correction after the recent pump. Losses in the past one week amount to 18.59%. With the latest strengths, a potential investor would see the weekly dip as a potential to take the token higher. We feel it could not be the right moment to buy the token.
Quant finds support at $170 amid a market correction.
The technical levels are established at $152, $129, and $88 for Quant. However, the token has found minor support at $170. Although the cryptocurrency tried to push higher from the support, the price was rejected near or at the $197 resistance. The rejection suggests buyers find it hard to break above $200. Bears may take control for a while before more buyers get in.
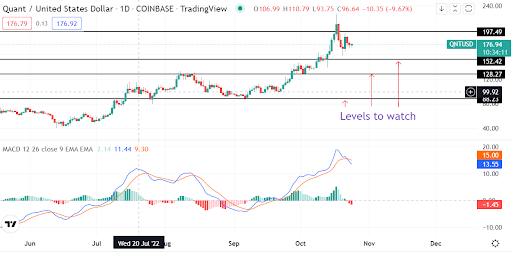 Source – TradingView
Looking at the daily chart, the sentiment is bullish for Quant, going by the monthly price movement. The price maintains above the moving averages, especially the short-term 20-day MA. On the other hand, the MACD indicator shows weakening momentum. The MACD line crossed below the signal line, an early indication of a developing bear market.
Which way Quant?
A technical outlook paints a mixed scenario for Quant token. The moving averages and monthly price movement reinforce a bullish view. On the contrary, the MACD indicator shows a declining momentum and a possible bear market.
Going by the current price action, we must wait before buying Quant. A break above $197 will confirm bullish momentum. A break below the $170 level or 20-day MA could force a decline to $152 or, potentially, to $129.