The price of NEM (XEM) against the US dollar could climb to $0.30 in the short term if bulls rally amid a broader recovery within the altcoin market
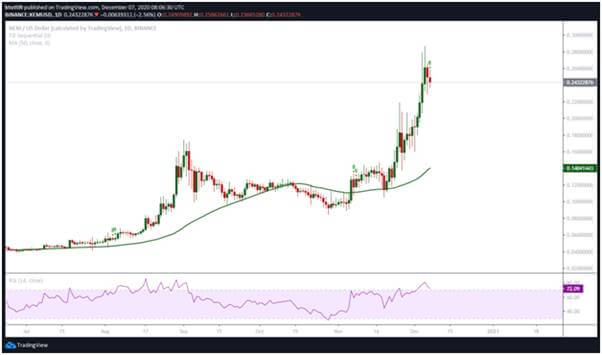
XEM’s price jumped to a monthly high of $0.28 after an impressive 51% upside this past week. As seen on the price charts below, bulls appear to be in charge and could still rally higher despite a reversal to lows of $0.23.
The outlook, therefore, suggests that XEM will have to rally as it did last week to hit the $0.30 mark. Over the past seven days, XEM outperformed Aave (38%), Synthetix (23%), Compound (23%) and yearn.finance (20%).
At the time of writing, XEM is trading around $0.24, over 35% in the green on the weekly chart.
XEM/USD
XEM posted incredible gains last week and could rally higher if bulls break above a major resistance area that resulted in the downturn to lows of $0.23.
If bulls break above $0.26, the overall bullish momentum within the market can help catapult the coin’s price to the $0.28 demand barrier. Above this, buying pressure can push XEM price to $0.30 and higher.
But while buyers target $0.30, sellers might have other ideas. As shown on the daily chart below, bulls will likely have to contend with downward pressure. The outlook is due to the sell signal that has flashed on the daily time frame via the TD Sequential indicator. The chart shows a green eight candle, which means if validated, it could confirm a short term bearish perspective.

XEM/USD daily price chart. Source: TradingView
The technical picture also has the RSI suggesting a potential downturn for XEM/USD. While bulls remain in control as the indicator trends within the overbought territory, its downsloping trajectory suggests bulls could be weakening.
If NEM’s coin price hits another downturn in the next few days, the main support levels on the daily time frame are at $0.23, $0.21 and the 50-day simple moving average at $0.14.

XEM/USD 4-hour chart. Source: TradingView
On the 4-hour chart, the 78.6% Fibonacci retracement of the decline from $0.26 high to $0.23 low provides an immediate barrier at $0.258. Above this level, a retest of $0.28 will open up a possible run to the aforementioned target.
On the downside, the 50-SMA ($0.21) provides support, with the gap between this and the 100-SMA ($0.18) and 200-SMA ($0.15) suggesting that bulls have the cover to absorb short term declines.

