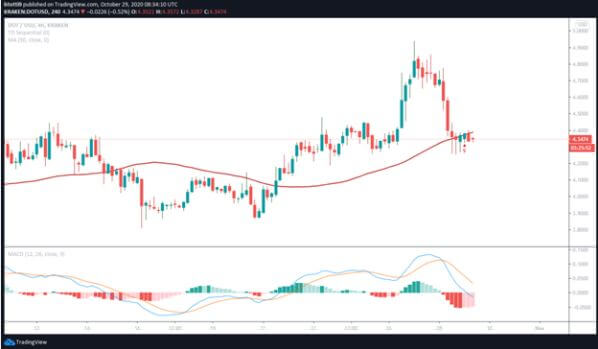
DOT/USD traded as high as $4.80 before increased bearish pressure pushed prices to lows of $4.25
Polkadot price has dropped below a key support area and looks increasingly weak on lower time frames.
The weakening bullish outlook comes amid widespread sell-offs in the crypto market, which could see the sharded protocol’s token trade lower in coming sessions.
Notably, DOT/USD faces strong resistance at an area bulls have attempted to break above several times in the past 24 hours to no avail.
DOT/USD short term outlook
The weekly resistance area around $4.44 remains the key price level for DOT bulls. The area provided the initial barrier to the breakout to highs of $4.80 and now appears to curtail the bulls attempt to break higher after a downward flip saw bears take the token’s value to lows of $4.25.
At the moment, bears are rejecting deals at the 50-day simple moving average on the 4-hour chart near $4.40.
The area is key as a breakdown from here could see DOT/USD plummet to lows of $4.00 and then $3.75. On the other hand, a breakout on the upside means buyers can target recent highs around $4.80 and the psychological level of $5.00.

As we can see on the chart above, the MACD is printing bearish to suggest short term price movement is more likely to remain downward. The down – sloping RSI offers the same prognosis short term.
But bulls could yet spring a comeback to prevent bears from taking prices lower. This likely movement for bulls is down to a technical picture provided by the buy signal formed on the 4 – hour chart. Here, the TD sequential has printed a red nine candlestick to suggest that the bulls have an opportunity to buy the dip, reposition and push higher.
For bulls, a breakout to highs of $4.80 will be likely if they hold prices above $4.35 and close within range of $4.40. The opposite, however, will encourage the bears to attempt pushing for the aforementioned price levels.
At the time of writing, the token is changing hands at $4.33 to the US dollar, down 3.95% on the day.

