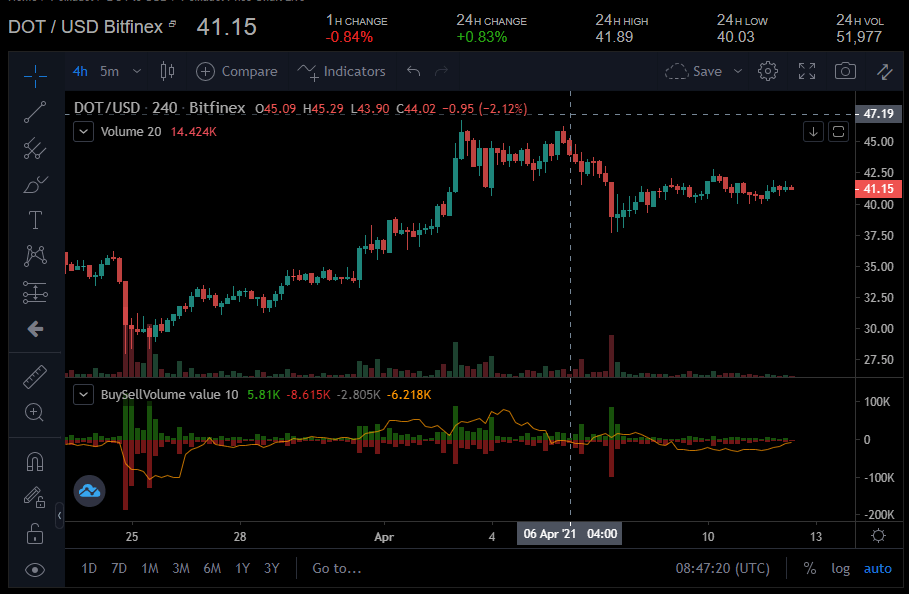
Polkadot has stabilised above the $40 mark over the past few days after slipping below $37 last week
The DOT/USD pair slipped below $37 on April 7 but has since bounced back to stay above $40 over the past few days. DOT is currently up by 1% over the past 24 hours. If the trend continues, it could target its monthly high of $46.71 soon.
DOT price outlook
A look at the DOT/USD 4-hour chart shows that most indicators point to a bullish breakout. DOT is currently trading above its 100-day simple moving average ($39.059). This comes after the DOT/USD pair established strong support at the $40 mark over the weekend.
The RSI is in the neutral zone (51.3), while the cryptocurrency’s MACD is slightly bullish, indicating that the market could move in either direction. The DOT/USD pair is up by more than 1% over the past 24 hours as it slowly reduces its weekly deficit.

DOT/USD 4-hour chart. Source: Coinalyze
If the positive trend continues, then DOT could soon break past the next resistance point at $42.92. If that happens, then DOT could be poised to reclaim its monthly high at $46.71.
However, if the bears regain control of the market, they could drop the price below the 200-day SMA ($37.39). Further decline could see DOT trading $33.25, a price which hasn’t been seen since last month.
DOT’s price has steadied above the $40 point despite Tether announcing last week it would be launching a new version of the USDT tokens on the Polkadot blockchain. This was huge news for the Polkadot community since Tether is the largest stablecoin issuer in the crypto space, with over $44 billion in market cap.

