Polkadot (DOT) could retest its all-time high or flip negative and revisit recent lows
Polkadot (DOT) is trading above a critical support level, with the price likely to break in either direction.
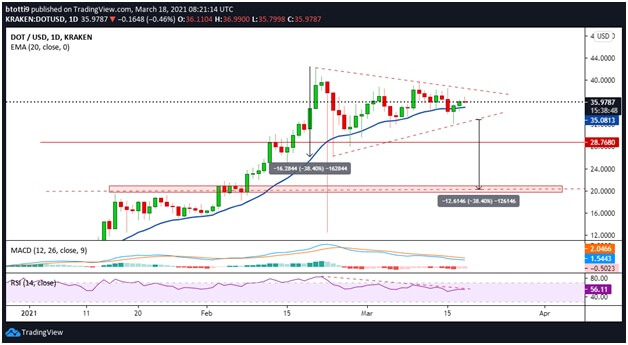
At the time of writing, the DOT/USD pair is changing hands around $36 and is in an uptrend. However, the cryptocurrency has struggled to break clear off the support line at the 20 EMA ($35.08) on the daily chart.
Buyers are thus likely to be interested in the price action above or below $35.
DOT price outlook
As seen on the daily chart, the Relative Strength Index (RSI) hovers above 50 to suggest bulls have the upper hand.
The formation of a symmetrical triangle pattern means DOT is poised for an upside breakout if the continuation setup suggested by the pattern holds. In this case, bulls can target a move towards the descending trend line of the triangle. The scenario could call for buy orders above the resistance line at $38.
If the price moves higher off these hurdles, increased buying pressure could push it past the all-time high of $42 reached on 20 February 2021. Further gains driven by a rallying market could see bulls target $52, an expected supply zone based on the projection of the symmetrical triangle pattern’s height.

Contrary to the above outlook, DOT/USD could also dip towards lows of $20.
This perspective will have its initial signal if bulls fail to consolidate above the 20-day EMA and prices decline to the ascending trend line. This is because a symmetrical triangle pattern can also suggest a potential trend reversal.
The MACD remains in the positive zone but could signal a reversal of momentum if it cuts below the signal line. A strengthening of the bearish momentum could happen if bulls cede advantage and DOT/USD declines to $30.
The negative divergence of the RSI (and a possible flip below 50) could hint at a decisive move by the bears. If the bears strike with prices below the horizontal line at $28, the next stop could be at $20.

