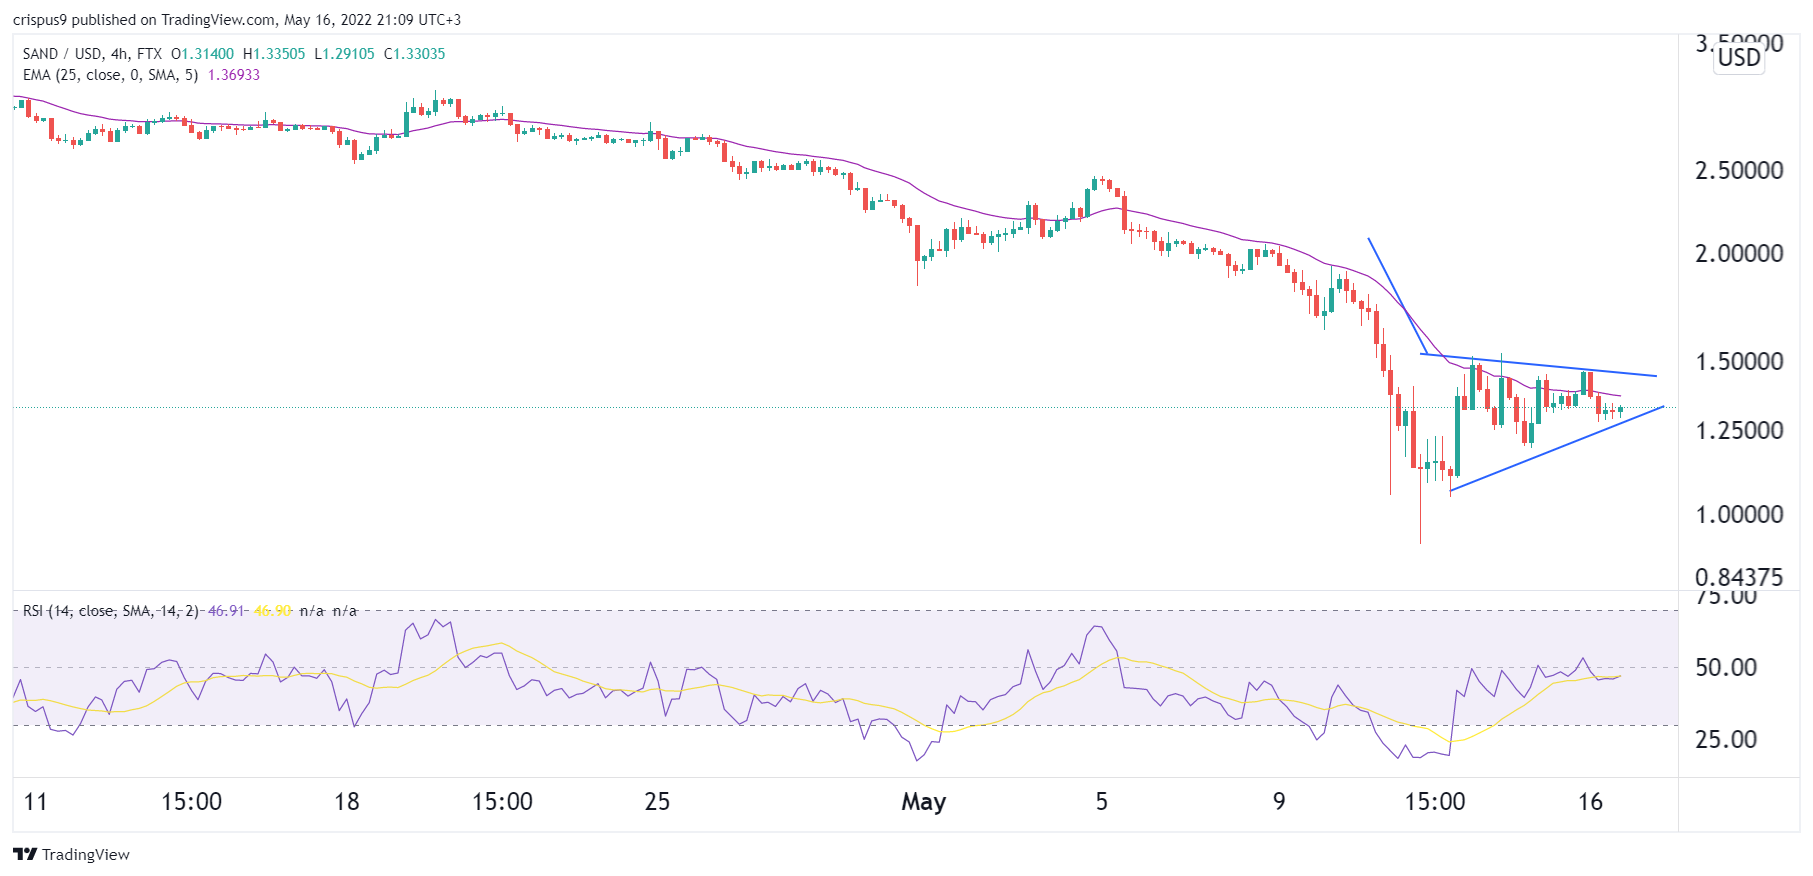
The Sandbox price remained in a tight range as investors reacted to the new roadmap plan for LAND holders. SAND is trading at $1.3225, which is significantly above last week’s low of $0.9272. As a result of this rebound, the coin’s market cap has risen to over $1.65 billion.
Sandbox roadmap
The Sandbox is a leading blockchain project that is in the metaverse and gaming industry. The network helps people and companies participate in the metaverse in a number of ways.
For example, the developers regularly host the Alpha season event where gamers participate in games and make money for winning. This money is usually in the form of SAND, the network’s native token.
The platform also has a diverse NFT marketplace, where people can buy products like avatars and other virtual products. It is one of the most popular NFT marketplaces in the industry.
Most importantly, people are able to buy virtual land and sell it later at a fee. Some people have spent millions of dollars on this virtual land.
Learn more about how to trade crypto.
At the same time, many companies like HSBC and Standard Chartered have made deals with Sandbox. These firms have bought virtual property in the platform for marketing purposes.
In a statement on Monday, the developers announced the roadmap for LAND holders. The developers will distribute 5 million SAND to all holders. Going by the current price, this distribution will be worth more than $6 million.
At the same time, LAND and ASSET will be moved to Polygon, a leading layer-2 network in a bid to lower transaction costs. People who migrate to Polygon will be eligible for over 1 million SAND rewards.
Still, the biggest concern among investors is whether the recent recovery is real or whether it is a bearish recovery.
The Sandbox price prediction

On the 4H chart, we see that the SAND price has been in a strong bearish trend in the past few months. The sell-off accelerated last week as Terra USD crumbled. Now, the coin has formed what looks like a bearish pennant pattern that is shown in blue.
It has also moved slightly below the 25-day moving averages while the Relative Strength Index (RSI) comeback has stagnated at 50. Therefore, the pair will likely stage a major pullback since the pennant pattern is nearing its confluence level. If this happens, the next key support will be at $1.10.

