-
Shiba Inu is consolidating amid bearish pressure
-
A delay in important network updates is holding back SHIB
-
The token is at a level of indecision and could trade either way
Shiba Inu SHIB/USD is locked in a consolidation, currently exchanging for $0.00001122. The price represents a dismal 1.4% increase in the past day. Significant fundamental developments are holding back the price of the canine-themed crypto.
Pressure is mounting over the official deployment of Shibarium. The developer, Unification, outlined the progress of the layer-2 platform last month without getting into the specifics. In the update, the developer said the advisory work was ongoing for the alpha and public testnets.
In other news, Shiba Eternity fans will have to wait longer for the card game. The P2E platform was expected to launch for Android and iOS on October 1. The ‘download day’ has moved to October 6. Aside from the delays, positive fundamentals lie in the SHIB trading volumes.
On October 2, the volumes surged 49%, according to data from EtherScan. The uptick was due to significant whale activities. Two deep-pocketed investors moved 200 billion and 100 billion SHIB tokens across multiple wallets. Despite the whales’ appetite, Shiba Inu remains subdued.
SHIB consolidates amid a downward momentum
 Source: TradingView
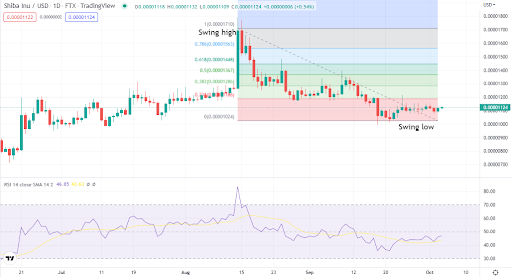
According to the daily chart above, SHIB is consolidating around $0.00001122. From the Fibonacci retracement levels, any potential uptrend could face immediate resistance at $0.00001286 (38.2%). $0.00001367 (50%) and $0.00001448 (61.8%) are the other levels to watch.
However, with RSI currently at 46, investors will have to wait longer for a trend reversal. The momentum indicator shows that more investors are selling than buying the meme token.
Concluding thoughts
SHIB is consolidating and facing two possibilities, a rally or a continuation of the downtrend. The RSI shows that the price could go lower before a reversal. In the second possibility, investors should be keen on the Fibonacci levels.

