Shiba Inu price plunged to the lowest point since January 19 as demand for cryptocurrencies waned and the enthusiasm of the Shibarium launch fell. SHIB retreated to a low of $0.000010, which was much lower than the year-to-date high of $0.000015. This means it has fallen by more than 31% from its highest level this year. In this article, we will focus on technical analysis in a bid to predict the next moves in Shiba Inu.
Shiba Inu price prediction
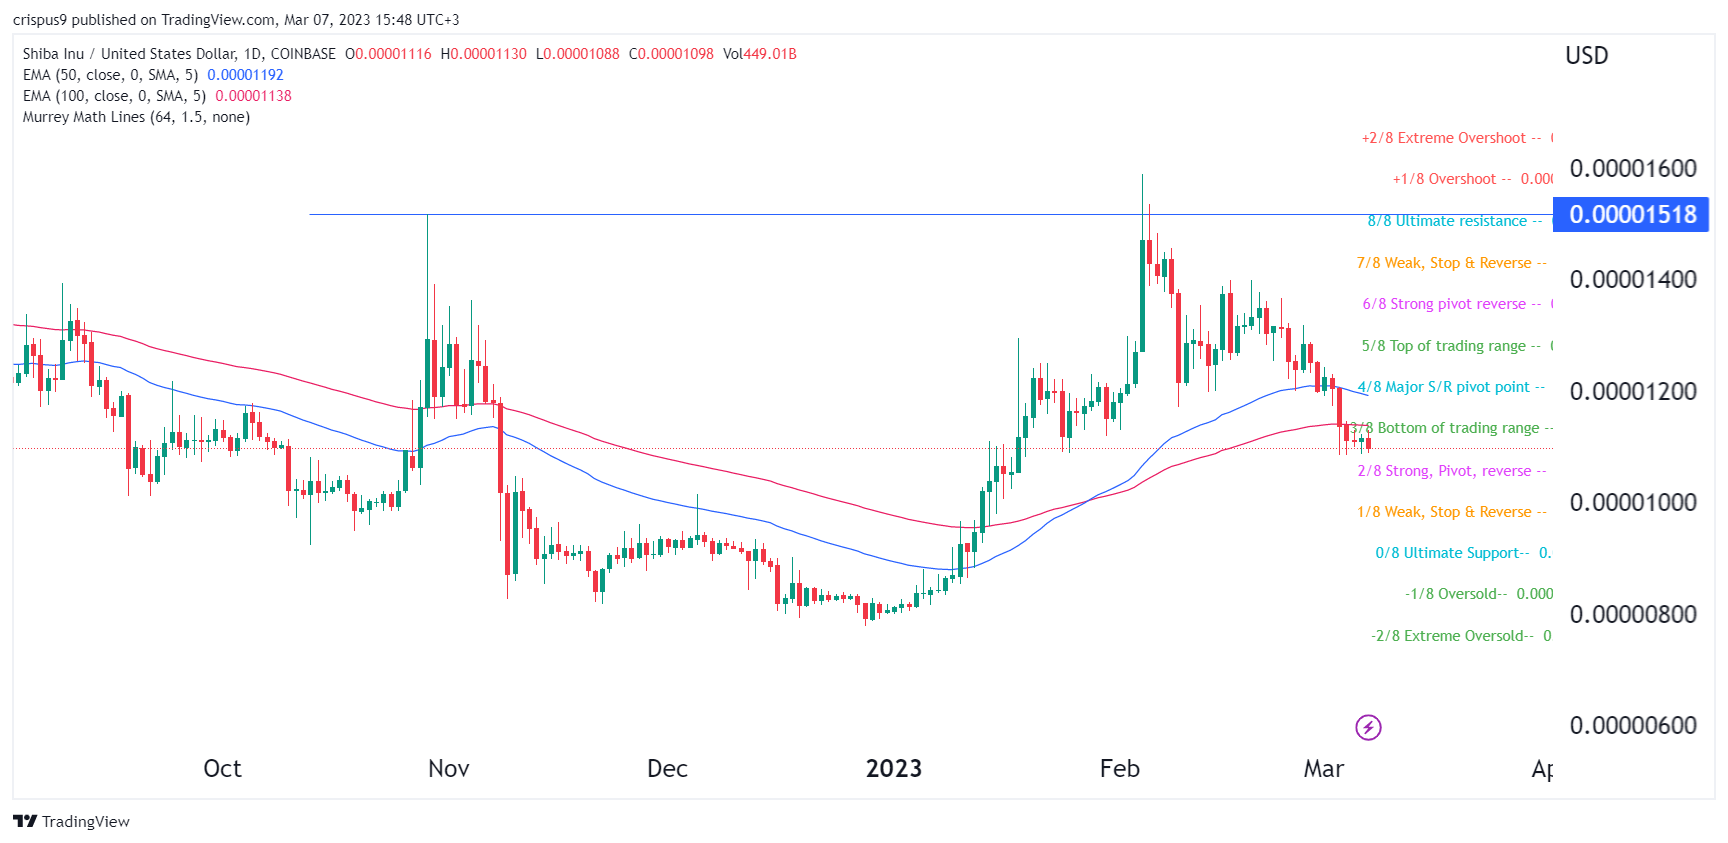
The ongoing SHIB price sell-off started when the coin surged to a high of $0.000015, which was the highest level on August 17. It reached this level on February 4. Since then, Shiba Inu has retreated below several important support levels. The most recent support point to break was $0.0000116, the lowest point on February 9. It was also the neckline of the head and shoulders pattern.
SHIB has moved below the 50-day and 100-day moving averages, signaling that bears are still in control. Now, turning on the Murrey Math Lines, we see that the coin has moved below the bottom of the trading range and is now above the strong pivot and reverse level.
Therefore, with sellers gaining momentum, I suspect that the coin willl move to the next ultimate support level at $0.0000090, which is about 18% below the current level. The stop-loss of this trade will be at the key resistance level at $0.000012, the major S/R level.
For starters, Murrey Math Lines are mathematical concepts that are based on the Gann theory. This theory states that prices tend to trend and retrace in 1/8th intervals. In this case, the 0/8, 4/8, and 8/8 levels are usually points of strong support and resistance.

SHIB price forecast 4H
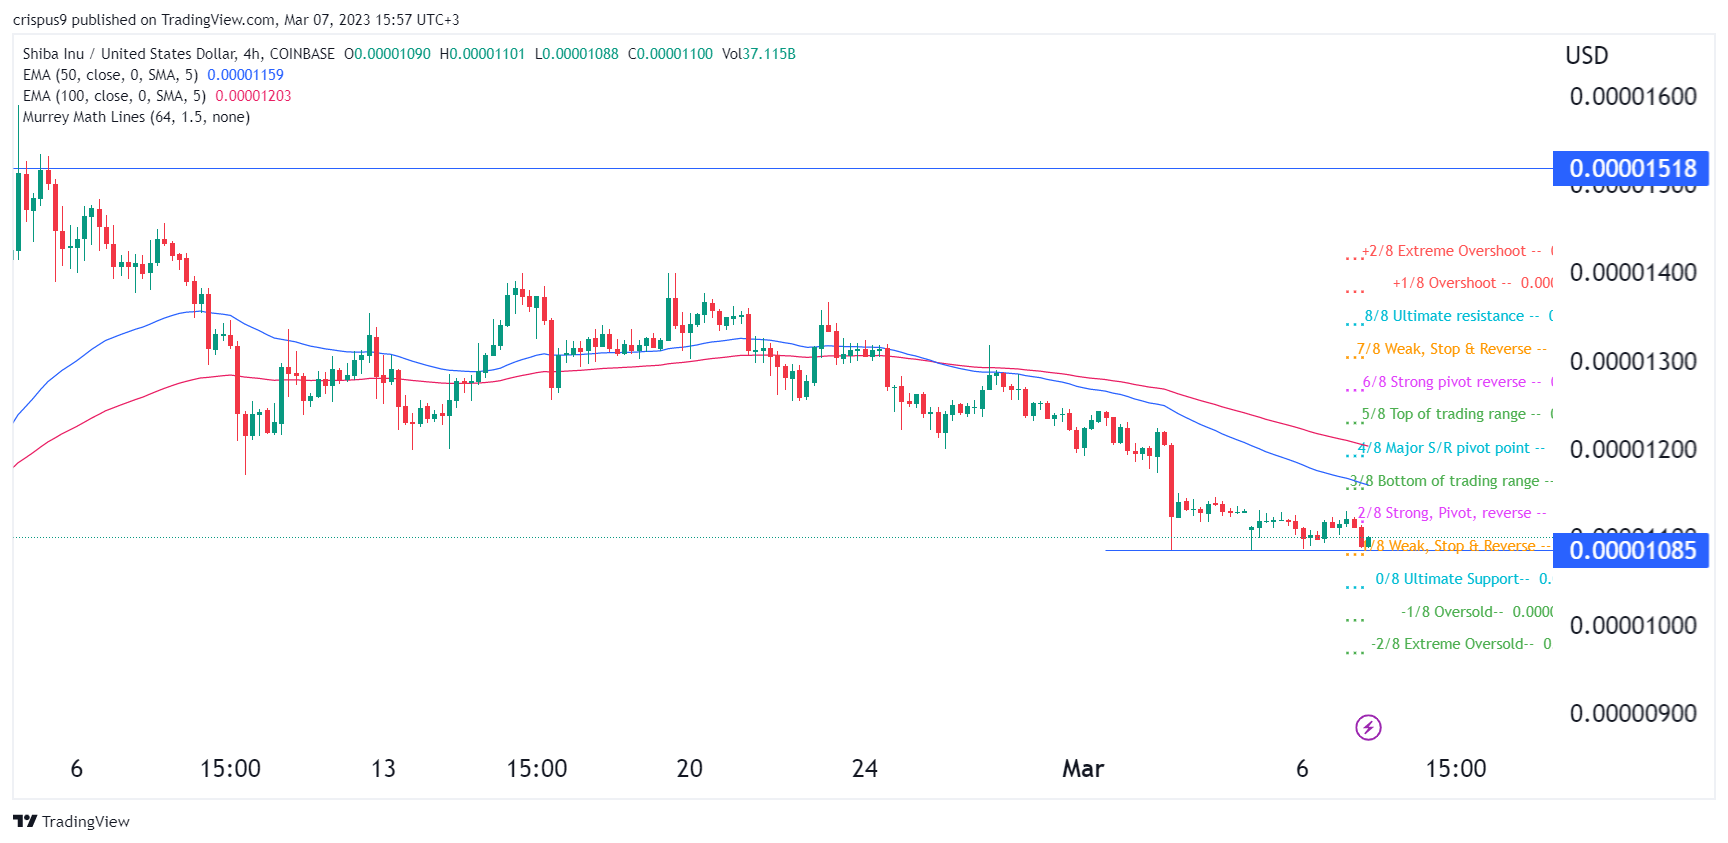
On the 4H chart, we see that the SHIB/USD price has been in a strong bearish trend in the past few days. The coin is sitting slightly above the key support level at $0.000010, which was the lowest point this year. It is also hovering slightly above the weak stop and reverse level. Like in the daily chart, the SHIB/USD remains below all moving averages.
Therefore, the coin will likely have a bearish breakout as sellers target the next key support level at the $0.000010, which is the ultimate support level.


