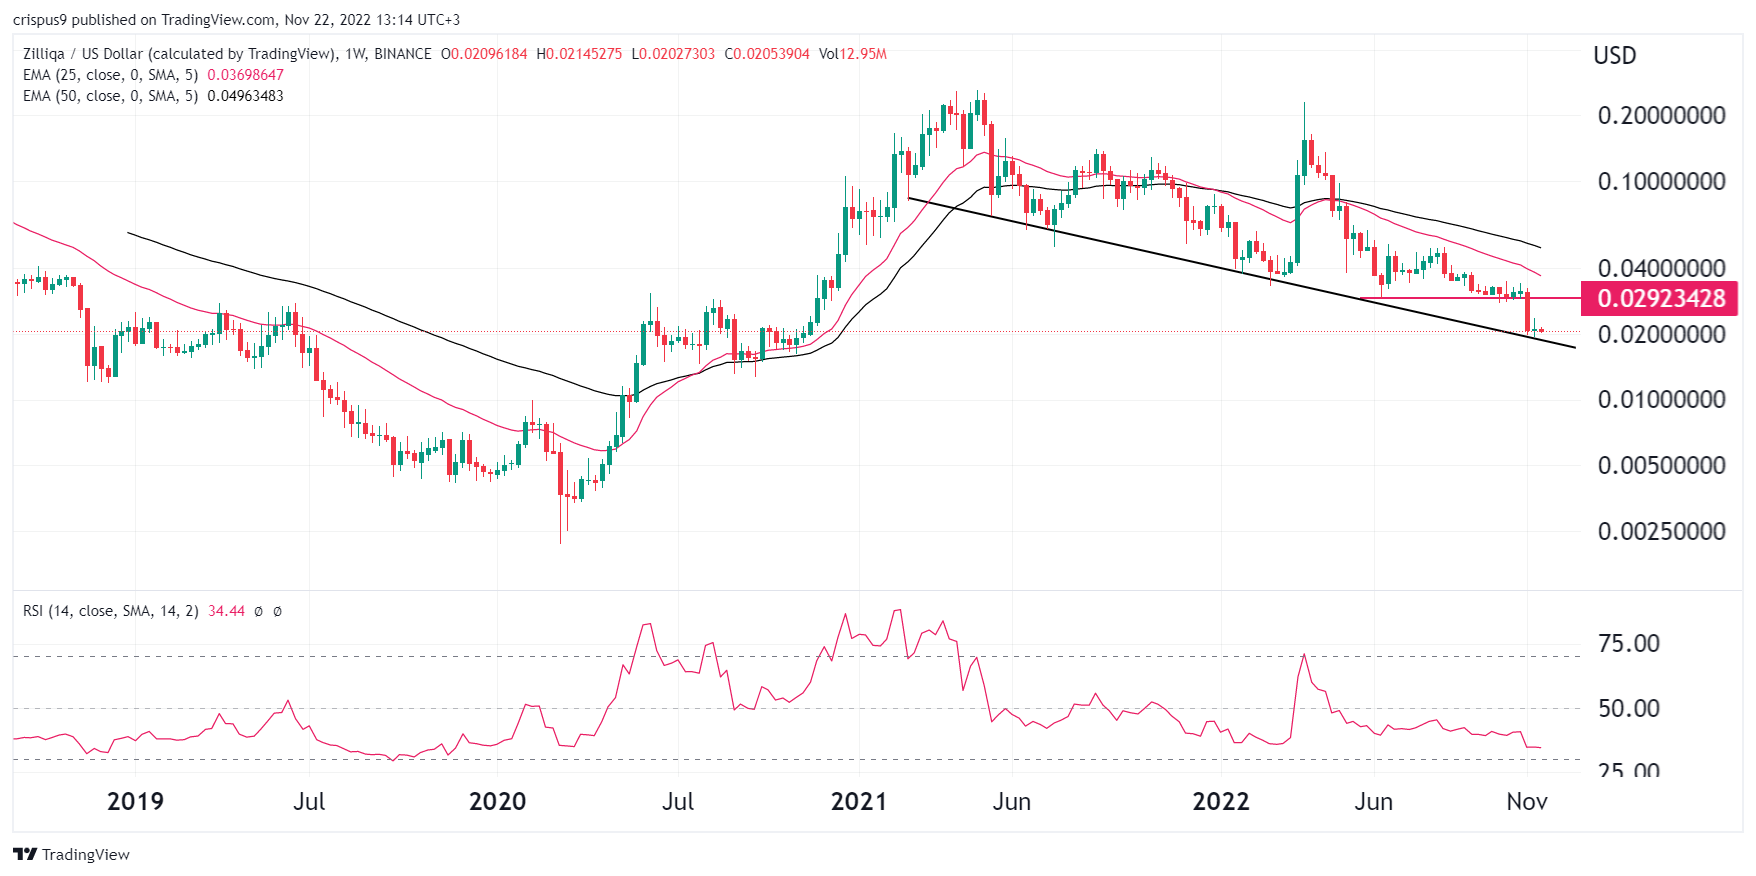
Zilliqa price has been in a strong bearish trend in the past few months. ZIL plunged to a low of $0.020, which was the lowest level since November 2020. This means that the coin is on a path to losing most gains it experienced during the pandemic. It has crashed by more than 90% from its highest point this year.
Why is ZIL crashing?
Zilliqa is a leading blockchain pioneer that introduced the concept of sharding. Sharding improves the performance of a blockchain platform by breaking down its blocks into smaller units known as shards.
In the past few years, sharding has been embraced by various blockchains. Most notably, Ethereum is expected to implement the technology in 2023. After that, transaction speeds in the network will grow from less than 20 per second to thousands. Other networks that are using sharding are Elrond, Near Protocol, and Polkadot.
Zilliqa price has been in a strong bearish trend in the past few months for several reasons. First, the performance of Metapolis, its metaverse as a service (MaaS) has not performed as was widely expected when it was launched in Miami. It is not alone. Other metaverse projects like Decentraland and Sandbox have all underperformed.
Second, Zilliqa has not performed well in the DeFi industry. A good way to measure this performance is to look at the volume of assets locked in the network. It currently stands at $4.1 million, with Zilswap having a market dominance of 99.96%. At its peak, Zilliqa had a TVL of over $200 million.
Third, Zilliqa’s performance in the Non-Fungible Token (NFT) industry. There have been no major NFT collection launched in Zilliqa that could compete with the likes of Bored Ape Yacht Club and Otherdeed.
Finally, like other coins, ZIL price has been hit by the ongoing collapse of FTX and Alameda and the past meltdown of Terra. FTX was the second-biggest crypto exchange in the world.
Zilliqa price forecast

Zilliqa price chart by TradingView
So, is it safe to buy Zilliqa? Turning to the weekly chart, we see that the ZIL price has been in a strong bearish trend. A closer look shows that it has formed a descending head and shoulders pattern. The current price is along the lower side of this pattern.
Zilliqa has moved below all moving averages while the Relative Strength Index (RSI) moved below the oversold level. The Stochastic Oscillator has also continued falling. Therefore, the coin will likely continue falling as sellers target the next key support level at $0.0100.

