


XLM/USD price is $0.072 and is turning massively bearish as the highly reliable evening Doji star forms on the monthly chart.
The technical picture for Stellar’s XLM token is strongly bearish as a candlestick pattern on the monthly chart appears.
As of writing, the XLM/USD pair is trading around $0.073, largely unchanged over the last 24 hours. However, with prices capped below a strong resistance area, a validation of the pattern and a combination of technical signals on lower time frames could see the price tank to new lows.
On the flip side, a strong showing on LTFs could invalidate the bearish outlook if bulls hold prices above the psychologically important level of $0.070.
Stellar traded as high as $0.119 on August 17th but has been in a downtrend since to see its price sink to lows of $0.066. While a slight upside between September 23rd and 24th lifted part of the gloom, a subsequent reversal has seen bulls capped below the 50 MA and 200 EMA. These areas on the longer time frame offer strong rejection points.
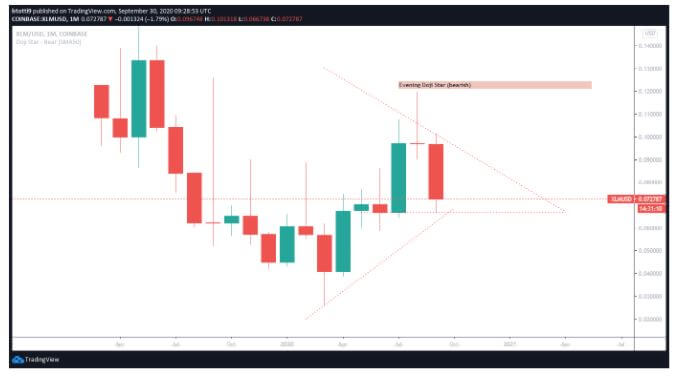
Looking at XLM/USD on the monthly chart we see that the cryptocurrency has formed the evening Doji star. This candlestick pattern presents with three candles: you can pinpoint a long green candle, then one with an extended upper shadow but with an insignificant body, and finally a red candle that extends lower.
The XLM/USD pair has this pattern formed; suggesting added selling pressure might see it register further downward action.
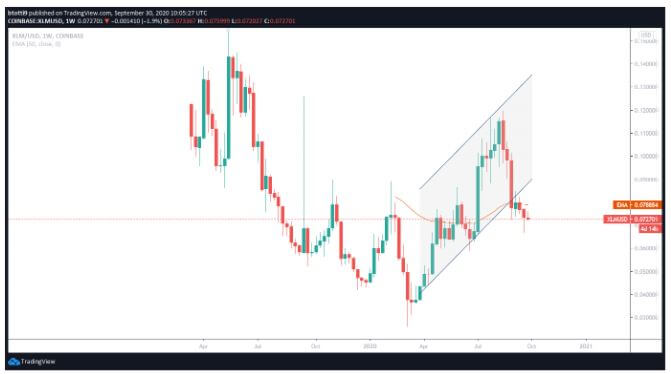
On the weekly chart, the XLM/USD pair has crossed under the lower trendline of an ascending channel formed from June lows of $0.059 to August highs of $0.119. The cryptocurrency is also changing hands below the 50 EMA that provides resistance at $0.078.
As noted above, keeping prices above $0.070 is essential if bulls can prevent any would-be downside from bringing into play the 50 MA line at $0.068. Below that, the next refuge is at $0.46
As such, bulls need to break above the short-term moving averages to retain any chance of revisiting the important area around $0.08.
If the prevailing sell-off pressure sustains, the technical outlook for XLM/USD would be decidedly bearish. An advantage to the bears means prices around $0.068- $0.06 is the next target. The RSI continues to slope, suggesting sellers still have the upper hand.
If we look at the daily chart, the price of Stellar against the US dollar is capped by a strong hurdle at the 23.6% Fibonacci retracement level of the downswing from highs around $0.119 to lows of $0.07. That hurdle is at $0.08.
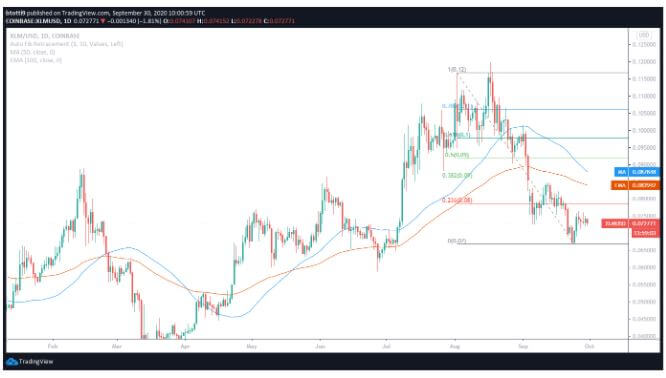
The 100 EMA ($0.083) and 50 MA ($0.087) are followed by the 50% and 38.2% Fibonacci retracement levels that offer the next challenge at $0.09.