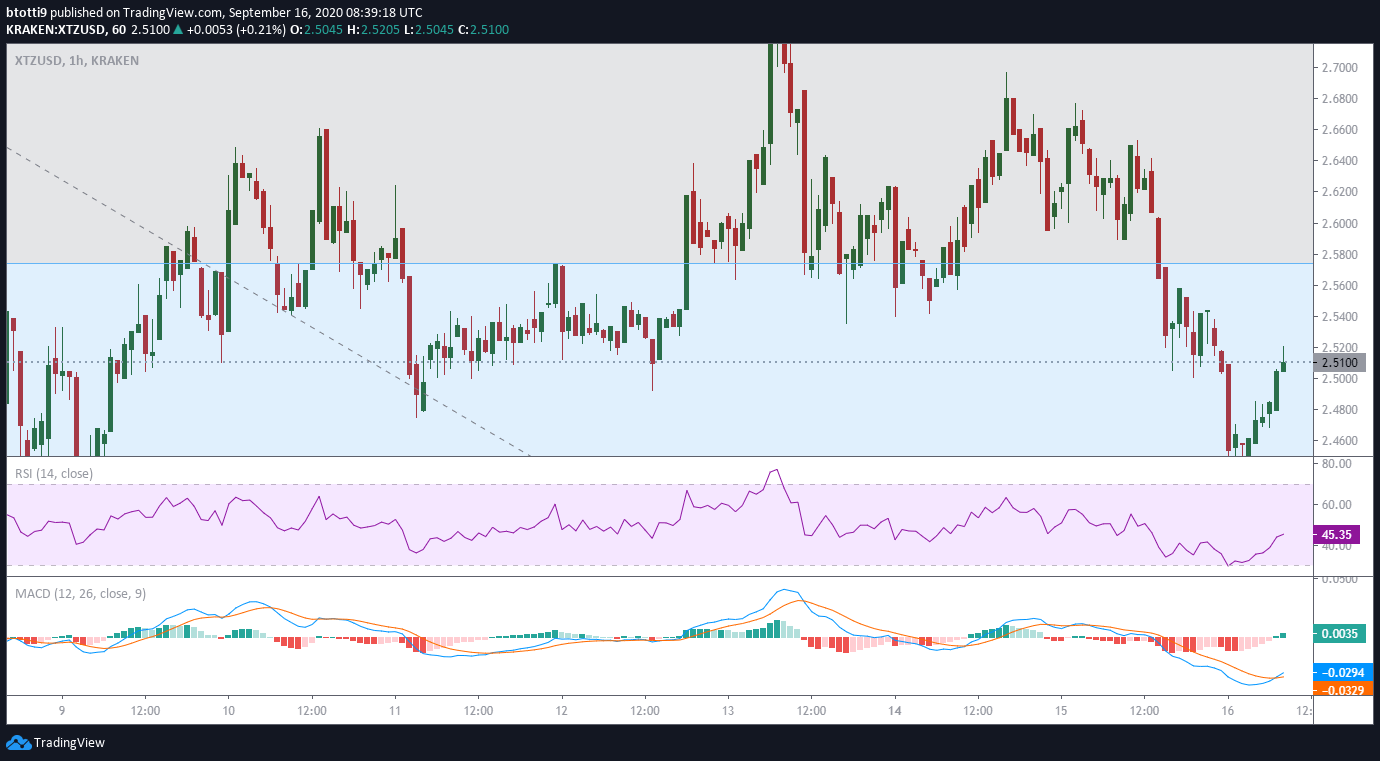
XTZ/USD is trending green in lower time frames and bulls need to close higher on higher time frames to confirm a bullish case.
Tezos price is down 4.7% on the day and looks primed for more losses if bulls cave in to further bearish pressure as seen in the early trading session.
The pair is trading around $2.50 as of writing, having touched lows of $2.44, with the price action seemingly impervious to the news that the French government is looking to use the Tezos blockchain to develop its Central Bank Digital Currency (CBDC).
Research and development firm Nomadic Labs announced September 15 that France’s Societe Generale-Forge (SGF) had selected the Tezos blockchain as a platform upon which to build the country’s experimental CBDC.
According to the firm, which is set to contribute to the central bank project, Tezos’ selection is down to its strong technical fundamentals. These include: robust on-chain governance, proof-of-stake consensus mechanism, and officially authenticated smart contracts.
Such news is obviously a bullish signal for the Tezos price, except that that recent sell-off pressure is proving hard to shake for Tezos bulls.
XTZ/USD price outlook
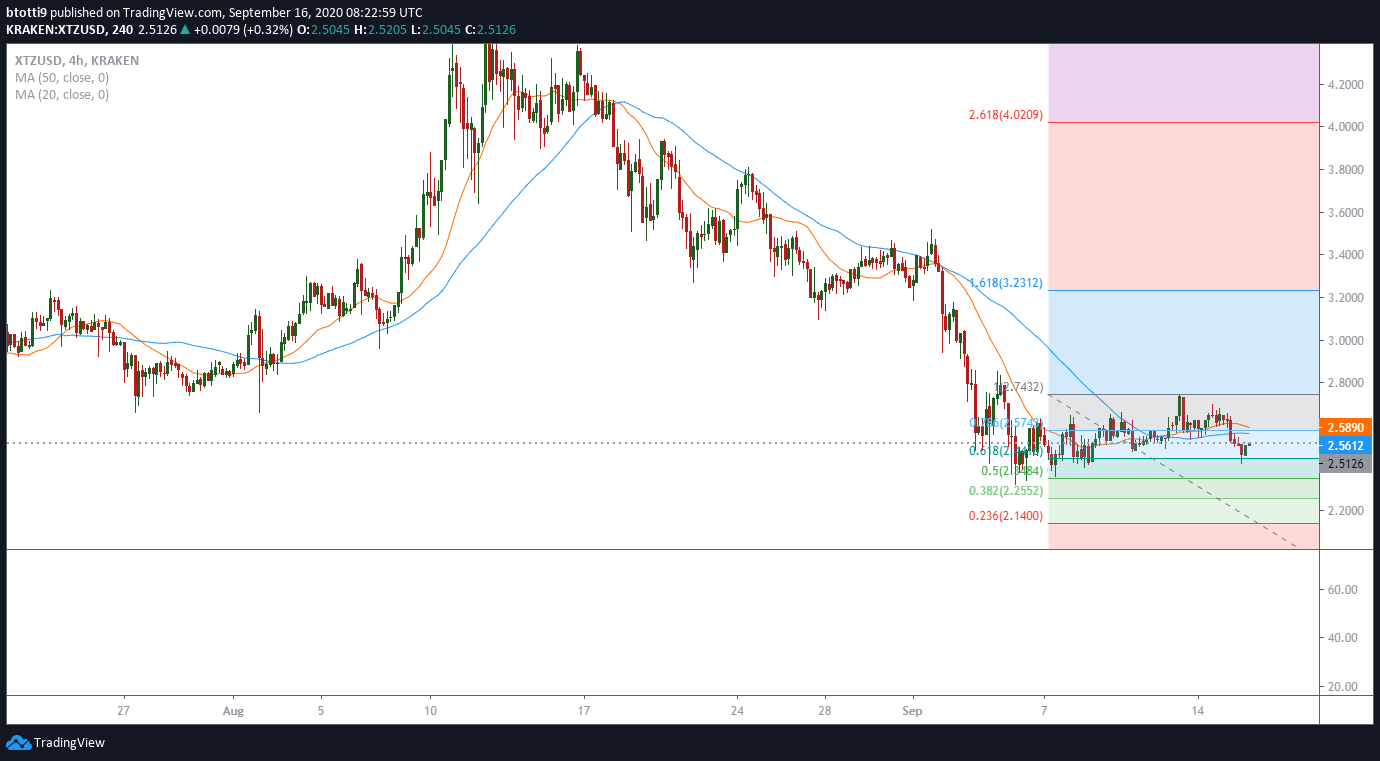
Tezos traded at a high of $4.5 in August, but a subsequent dip over the past month has seen its price dip to a low of $2.38. Although the cryptocurrency remains within an overall uptrend, as suggested by the bullish buy signal formed over the past three days, the outlook on lower time frames suggests XTZ/USD is likely to struggle below $3.00.

The 50% Fib and 61.8% Fib levels at $2.56 and $2.60 zones are areas of interest. It is also the area with the 20 and 50-day simple moving averages. Building fresh momentum above the zone will allow bulls to attack the resistance at the 78.6% Fibonacci retracement zone, which forms a critical area of the swing low from $2.9 highs to $2.3 lows.
If a breakout happens above overhead resistance, bulls would likely aim at $3.0 and validate the long term bullish case observed on higher time frames.
Conversely, a downswing will push XTZ/USD to lows of $2.3 seen on September 2nd. An extended drop to these levels might accelerate panic selling and see bears seek blood around July lows at $2.00. Beyond that, further losses would welcome Black Thursday’s $1.7.

As of writing, XTZ/USD is forming a bullish divergence as the RSI begins to extend away from the oversold zone. The MACD is also turning bullish on the 1-hour chart to suggest bulls might yet prevent a drop to monthly lows.

