-
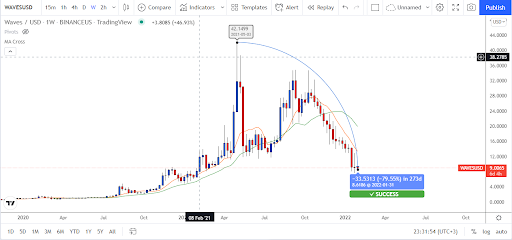
The price of WAVES has been spiraling down without a halt.
-
WAVES is seeing slight resistance at $10.3.
-
WAVES/USD is currently trading at $9.13.
 Source – TradingView
The Waves pricing shows a strong bearish trend, with bears dominating the price charts for the majority of the months since October. After being rejected at $10.3 on January 27th, the price levels have sharply plummeted, and the coin value has dropped to the $9 zone. The collapse had an effect, and the bearish trend has persisted today.
WAVES/USD one-day price chart: bulls advanced to $12.8 resistance level
Over the weekend Waves price evaluation indicated a negative trend, and the price has dropped to $8.55 today. The previous week's price chart was characterized by red candlesticks, indicating that bears were continually pushing the price to fall; however, bulls also made strong gains on January 26th, taking the price point to $12.8. Since then, bears have been impeding upward price trends, but today, the bears have gained a little profit as the price is currently locked in the $9.15region.
The MA is trading at $9.55, barely under the price point, while also remaining below the SMA50 curve, indicating a negative trend. Conversely, if we look at the 9 days Simple Moving Average signals, the resistance is at $16, indicating the highest volume pressure is at that level.
The four-hour Waves pricing assessment reveals that the bulls dominated the price component for most of today's trading period, but bears triggered a sharp price drop today, following a continuous bullish lead. Despite the negative momentum being low, it has outperformed the bullish momentum and made the daily candlestick bearish. Yet, the value has been seen to be rising during the previous eight hours.

