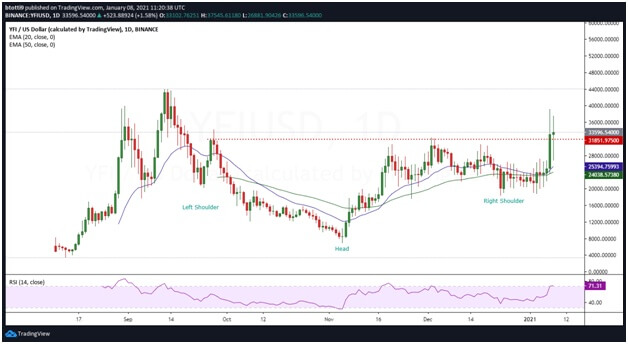
Yearn.finance (YFI) price could jump to $43,000 if prices remain above the neckline of a key price pattern
Yearn.finance (YFI) has had a strong few days after struggling for an upside during the fourth quarter of 2020. But after breaking above $24,500 on 3 January, the token’s price posted an impressive run that saw it touch intraday highs of $39,134 yesterday.
During the upside, the decentralised finance (DeFi) token attracted strong buying pressure. The 33% jump in prices also coincided with a surge in intraday trading volumes. According to data from CoinMarketCap, the intraday trading volume spiked 168% today, with intraday trades topping $1.8 billion.
One likely source of the immense upward volume was news from cryptocurrency exchange Binance. The platform announced yesterday that it would be launching YFI staking, potentially spiking the interest in the DeFi giant.
At the time of writing, YFI is trading around $33,590. However, despite the declines, it remains above a crucial price pattern and could see another leg up short term.

YFI/USD daily chart. Source: TradingView
The daily chart shows YFI/USD has broken above an inverted head and shoulders pattern.
If the price stays above the pattern’s neckline, the next target is the resistance around $36,500. The bullish continuation pattern suggests breaching the $40k level would allow bulls to attack the all-time high of $43,966. Beyond this level, YFI/USD could rally to $50,000.
While bulls retain the upper hand in a resurgent altcoin market, the bullish outlook could turn negative if prices drop below $32,000. This zone provides a crucial support level at the neckline of the inverted head and shoulders pattern.
Should sellers take charge short term, YFI/USD sinking beneath the said neckline could welcome more selling pressure. From here, sellers could mount more pressure and target the 20-day EMA ($24,435) and 50-day EMA ($24,055).
Should bulls fail to stem the decline at these support levels, the next stop could be at $18,000.
The daily candlestick features a long wick to suggest the downward path could accelerate if there is aggressive selling towards the close.
The RSI also remains lodged within the overbought territory, meaning it might overextend and bears may gain an advantage.

