If the right shoulder in the H&S pattern fails to complete, the continuation of an ascending triangle could suggest a bullish reversal
Bitcoin (BTC) could see a major pullback in the coming weeks if a bearish pattern formed recently validates the negative outlook. Despite its recent rebound to highs of $37,000, the subsequent rejection towards $32,000 seen in the past several hours suggests that $30,000 is now the main support zone.
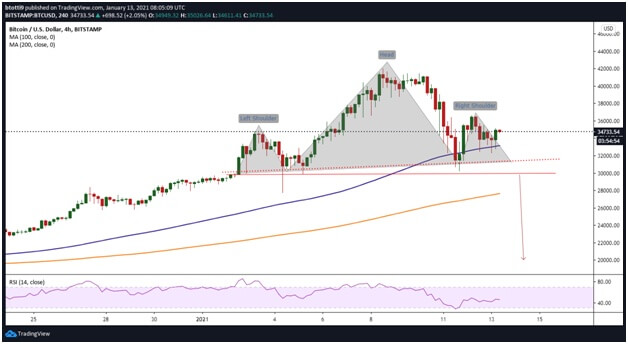
But a bearish outlook in the form of a classic head and shoulders (H&S) pattern on the 4-hour chart hints at a potential short term dip. At the time of writing, BTC/USD is looking likely to complete the pattern’s right shoulder, with the neckline a key level to watch.
According to one analyst, a break below this line might see sellers target a dump to the region around $20,000.
In a video shared to 93.8k followers on Twitter, the analyst notes if the right shoulder of the H&S pattern keeps unfolding and then confirms, we could see Bitcoin drop below $30,000. This is where the neckline lies and it is also the zone of previous support.
In this case, an hourly candle below the critical support level will turn the zone into a resistance area. From here, the pattern’s price target extends to the $20,000 level.

Bitcoin 4-hour price chart showing an unfolding H&S pattern. Source: TradingView
According to the analyst, the bearish scenario only unfolds if the right shoulder confirms and the price breaks below the neckline. If price trends higher, it’s likely to invalidate the bearish picture and see BTC/USD target a breakout to the resistance line at $36,000.
A combination of miners’ heavy selling, reduced stablecoin inflows and no major Coinbase outflows appear to point to a short term dump, according to Ki-Young Ju, the CEO of analytics firm CryptoQuant.
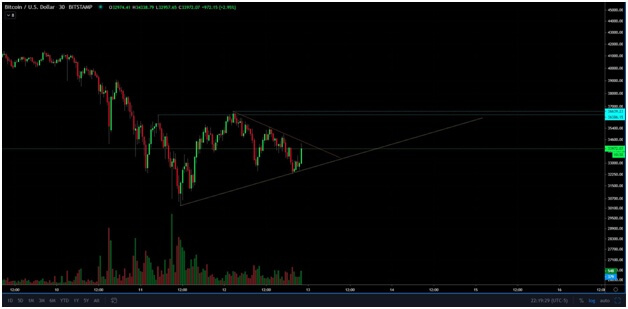
However, while Ki-Young Ju says BTC faces another dump after the recent 28% dip, another analyst believes the market could witness a bullish reversal. According to him, the pop to $34,000 suggests Bitcoin is likely trading within an ascending triangle.
Nonetheless, Jonny Moe notes that BTC/USD is “still inside [a] more localised downtrend”.
As such, bulls need to break the downward trend in order to strengthen the outlook of the triangle pattern.

Bitcoin chart showing possible ascending triangle pattern. Source: Source: Jonny Moe
According to CoinMarketCap, the aggregate BTC/USD value across all exchanges it tracks is $34,868. A bullish reversal could see bulls focus on $40,000 level.
On the downside, the 100-SMA, the psychological $30,000 line and the 200-SMA provide initial support levels should selling pressure mount.

