Bitcoin (BTC)
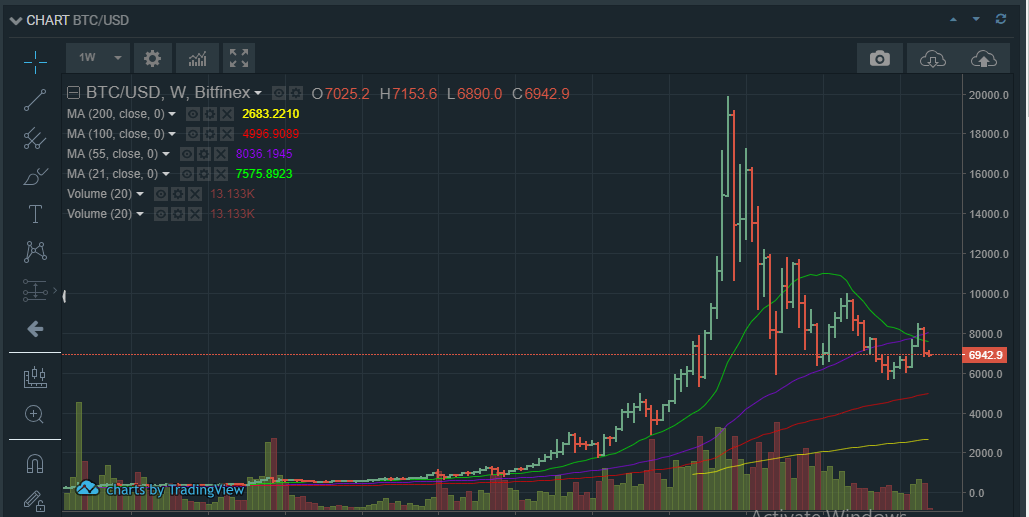
Bitcoin has started the week in negative territory opening trading at last week’s low of $7073. Bears still have control over this market, and have managed to force it below the $7000 psychological support level.
However, the recent price drop may not last that long, if the pattern on the weekly chart holds. In this chart, Bitcoin (BTC) has formed an inverted heads and shoulders pattern. The first shoulder is at $6900 and was at that price in March of this year.

The head is at $5700 and was there in June of this year. Right now a shoulder pattern is forming at around the $6900 price level. Therefore, if the $6900 level holds, Bitcoin could be headed for a reversal that will see its price rise to $10,000, which is the first level of major resistance on the upside.
In the day, the bitcoin (BTC) charts confirm the possibility of a price reversal. Bitcoin is currently trading along the 55-day moving average, and has started ranging along this level. In the last 3 days, bitcoin (BTC) has touched this price three times, but has failed to break below it.
This means that sellers are most likely losing momentum. If this price level fails to break, then bitcoin (BTC) will most likely reverse in the next 24-hours, with a target of $7500, which is the first resistance level along the 100-day moving average.
Ethereum (ETH)
Unlike bitcoin’s weekly chart which shows signs of a reversal, Ethereum (ETH)’s weekly chart is showing signs of a bearish continuation. That’s because it has broken below the $445 support level and with a high momentum. Like bitcoin, this is an indicator that bears are firmly in control of this market. If this selling momentum continues, Ethereum (ETH) could drop to $365, which is the first major long-term support level.

The day chart pretty much confirms the bearish momentum in the weekly charts having broken below the $421 price level, and now consolidating below it at $415 to $400.
This is a sign that short sellers are consolidating their shorts, while the few bulls left in the market are cutting their losses. Once it breaks below this range, Ethereum (ETH) could drop to $384, which is the first support level in intra-day trades.
Monero (XMR)
In the weekly charts, the value of Monero (XMR) is showing a possible bullish reversal, albeit a weak one. The coin has formed what looks like a double-bottom although this is not yet fully-formed.

If it holds its value, chances are that Monero will rise to around $182, a key resistance level in the week. However, if it breaks below it, then it could drop to $103.
In the day, Monero (XMR) stands a good chance for an upside push. It is trading along a key support level at $114, one that it has tested two times in the past. If it fails to hold, then chances are that it will be headed further into bear territory and could drop below $100.

