


Bitcoin traded as high as $10,918 for the first time in weeks as bulls took control
Bitcoin could reclaim the crucial $11,500 price area in the short term if bulls maintain momentum above the key area, which has acted as a tough hurdle in recent weeks.
Yesterday, publicly-listed financial firm Square announced it had purchased $50 million worth of Bitcoin. In the hours that followed, the bellwether cryptocurrency added over 2.5% to its value to cross the $10,800 barrier.
In the process, BTC/USD broke above a symmetrical triangle pattern and is sitting well above the SMA50 to suggest the hidden bullish formation is strengthening.
According to veteran trader Peter Brandt, Square’s announcement is a “major development”, with social sentiment notably improved after a couple of weeks of a downcast outlook.
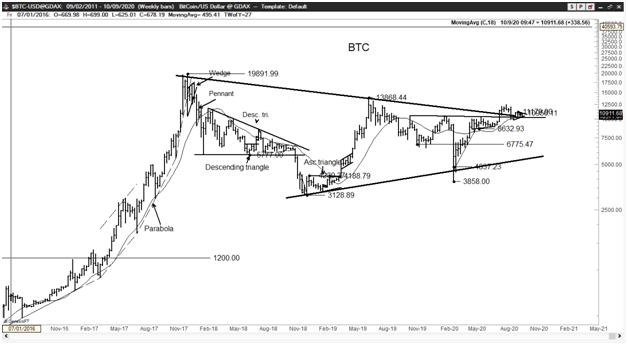
The highly-respected trader posted the chart below, noting that Bitcoin is “poised to flash a big buy signal,” on both the weekly and daily charts.
Although bulls failed to extend gains to $11,000, hitting an intraday high of $10,918 suggests the market is poised for a breakout.
BTC/USD price outlook
Looking at the daily chart, the height of the triangle suggests BTC/USD has its next target at around $12,500, the same level that formed the top of the last bull run from lows of $10,500 to highs of $12,486.
In the meantime, bulls face $11,700 as the next barrier according to IntoTheBlock’s IOMAP metric. There is a strong one million addresses barrier at this price level accounting for more than 740,000 bitcoins. Bulls will need to crack this wall to build momentum for the next high at $12,500.
To achieve this, buyers need to hold off sellers at the 50-day SMA that formed the barrier to the $10,918 high. As of writing, the bullish case is helped by the MACD and the RSI as seen on the daily chart.
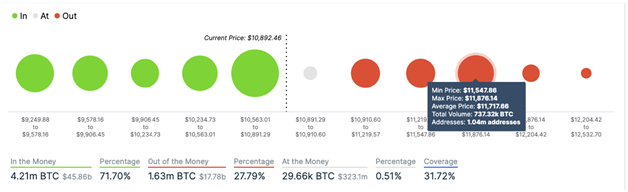
On the flip side, the upside momentum will end if sellers seize control. However, even in this case, bulls have a solid wall of support at the SMA50, where the IOMAP indicates over two million addresses entered the market at $10,800. Beneath this level, the next major support is around $10,500 and the base of the long-term supply area at $10,000 provides dependable refuge.