The technical picture and on-chain data for Bitcoin (BTC) price strongly favour a short term bearish flip to $16,000
Bitcoin price is looking to bounce after it plunged under $18,000 on the back of a sharp sell-off. The decline to lows of $17,640 followed another $1000 candle-down on Tuesday.
While bulls remain in control with prices above $18,200 at the time of writing, downward price action in the coming sessions will likely see bears attempt a retest of the $16,000 area. The negative outlook for a largely bullish Bitcoin market follows increased profit-taking since BTC price raced to a new all-time high (ATH).
Data shows that most of the downward pressure comes from long term holders selling to book profit.
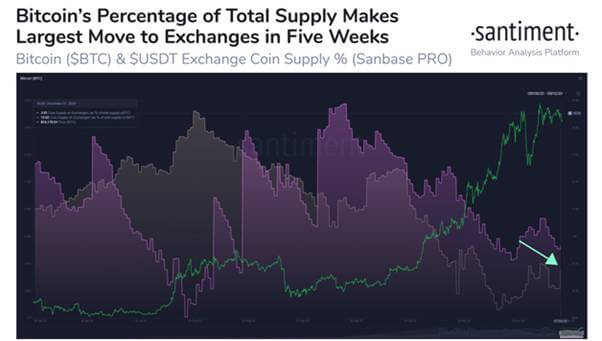
Analytics firm Santiment has revealed that nearly $280 million worth of Bitcoin moved to exchanges just before the recent sell-off. According to the firm, the inflow accounts for the largest such transfer to exchanges in over a month.

Percentage of Bitcoin supply that moved to exchanges before the sell-off was the highest in 5 weeks. Source: Santiment
The Santiment observation also supports what was seen from another on-chain indicator called the Coin Days Destroyed (CDD). The metric tracks movement of older coins and shows that the number of long-term holders selling their holdings has surged significantly.
Glassnode notes in the weekly outlook for BTC that an uptick in the CDD will likely lead to extended sideways trading, or it could suggest a sharp correction in the short term before prices rebound to a new ATH.
BTC/USD price outlook

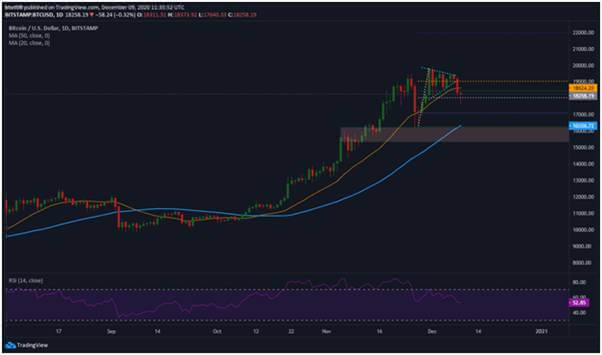
BTC/USD price daily chart: Source: TradingView
As noted earlier, Bitcoin might plunge to $16k or lower if bears take out the support at the mid-low range of $18,000—$17,000.
The initial anchor on the downside is at the 50-day simple moving average at $16,326. Below this, bears could eye the $15,300 level, with a retest of $14k likely.

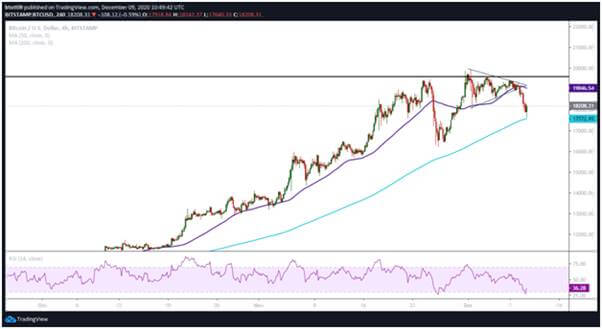
Bitcoin price 4-hour chart. Source: TradingView
But the recovery from the breakdown to $17,640 to highs of $18,300 suggests buyers remain hungry for upside action.
On the 4-hour chart, the BTC price is looking to rally above $18,000 after bouncing off the 200-SMA ($17,572). If bulls manage to sustain the upward trajectory, the next target is the 50-SMA area ($19,046), with a move to $19,500 likely to provide clarity as to whether the bottom was at the recent low.

