BTC price bounces to $55,200 after huge sell-off but bears could still sink it to support above $51k
Bitcoin’s price has bounced off lows of $53,400 after bears attempted to send it to yesterday’s lows of $51,540 — the lowest price level for BTC since 26 March.
As of writing, the BTC/USD is looking to break above the $55,200 resistance level. The technical outlook shows that Bitcoin has yet to shake off the bears even as bulls target a swift recovery towards $57k. The more negative scenario could see BTC price go south once more, with yesterday’s lows of $51,500 the primary attraction for determined bears.
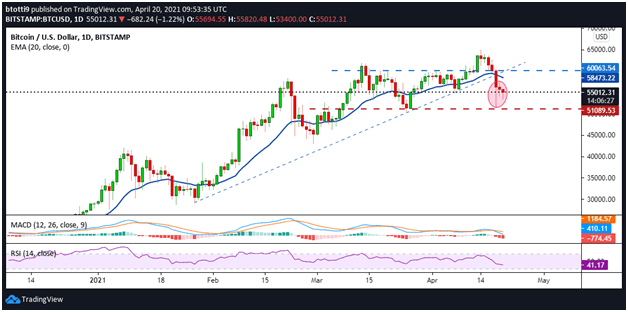
Bitcoin price daily chart

Bitcoin’s outlook on the daily chart suggests there’s strong support at $51,000. The dip from $60,400 to $51,540 was met with aggressive buying and the candlestick features a long lower wick. The view here is that Bitcoin retains a bullish bias as long as it stays above this line (dotted red on the chart).
But the bearish perspective on the daily timeframe is likely to strengthen given the MACD is consolidating below the signal line. The daily RSI is also slopping below 50 to suggest no immediate joy for bulls unless sentiment flips.
If it does, a breakout above $56,000 could take BTC to the 20-day EMA at $58,470. The next targets will be at $60k and recent highs of $62,500.
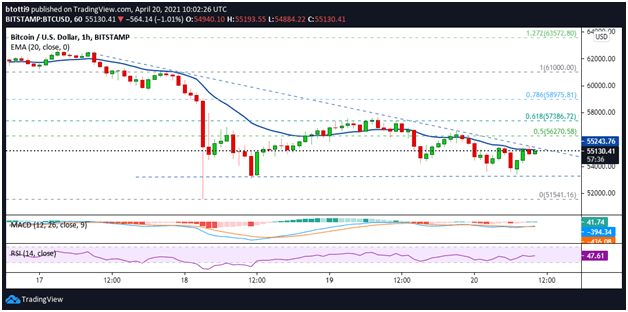
BTC hourly chart outlook

The BTC/USD pair has been trading within a declining triangle pattern on the hourly chart. As the chart above shows, the pattern’s resistance line has thwarted bullish advances multiple times.
However,the last three hours have seen bulls record some wins as they aim for a break above the descending trend line.
The technical picture suggests immediate pressure faces Bitcoin at the 20-day EMA near $55,243. Although the hourly MACD suggests a bullish reversal is in play, the RSI remains below the midpoint despite ticking up slightly. This suggests another struggle near the $55.5k zone and the 50% Fib level ($56,270).
If prices break lower, the initial support zone is at the 23.6% Fib level ($53,776), from where bears could attempt to revisit the primary support zone near $51k.

