Bitcoin is likely to break higher after consolidating around $33,000 for most of the weekend
Bitcoin price has surged by about 3% in the past 24 hours and is looking to break higher. This follows last week’s solidifying of support around the $30,000 line.
Keeping the support line and crossing the $34,500 mark are positive signals for the weekly outlook.
The benchmark cryptocurrency is also likely to see some upside action as the week starts given the bullish sentiments of Tesla CEO Elon Musk.
After changing his Twitter bio to #Bitcoin last week, the world’s richest man now supports BTC. According to Forbes, the billionaire has also said that Bitcoin is ready for greater adoption. Making his comments on the audio chat platform Clubhouse, he noted:
“I am a supporter of bitcoin. I am late to the party but a supporter.”
A strengthening of the short term bullish picture could therefore see buyers target a run towards the $40,000 level. On the contrary, a breakdown from current prices and a retest of $30,000 could see validation of a bearish chart formation. If this happens, prices could drop as low as $21,000.
BTC/USD
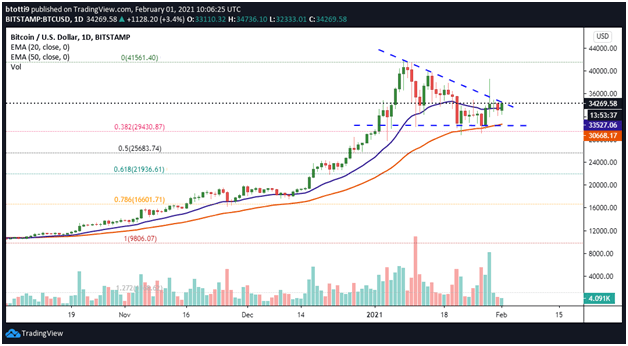
The daily chart shows Bitcoin printed a long wick, then a Doji candlestick pattern over the weekend. The long wick points to the aggression by which bears defended prices around $38,000. On the other hand, the wick showed a lack of decisiveness from both buyers and sellers.

BTC/USD daily chart. Source: TradingView
As can be seen on the chart, bulls are trying to break above the descending trendline that has so far aided the bears’ stubbornness. The bearish resolve will weaken even further if bulls pull away from the trendline.
The 20-day exponential moving average ($33,546) now acts as an immediate anchor, with prices retesting the $34,500 barrier. However, it’s likely some sellers could still be hovering in the shadows around $38,800. If there is increased buy-side pressure, the BTC/USD pair could easily surge to $40,000-$42,000 region.
Failure to clear the hurdle set by the downward trend line (blue dotted), could see BTC/USD decline to the horizontal support line.
The price action, in this case, would include a breakdown past the 20-EMA ($33,546), with major support likely at the 50-EMA ($30,672). There is also the horizontal line at $30,000 that looks solid at the moment.
A breakdown beyond $30,000 validates the bearish outlook hinted to by the descending triangle pattern. If this happens, bulls have initial support at $28,800. The 0.5 Fibonacci retracement level ($25,673) and the 0.618 Fibonacci retracement level ($21,936) also provide further support.

