- Bitcoin price outlook after this week’s Silvergate and Tether news.
- BTC is hovering around $22,400 with key resistance near $23k amid a potential technical breakout to YTD highs.
- The $20k zone is a critical and psychological level for bulls.
Bitcoin price remains constrained below $22,500 after posting a sharp decline on Friday following a combination of broader market weakness and negative crypto-related news.
However, with price above $22,000, the technical outlook suggests bulls might still have a chance to push for new year-to-date highs in March or April.
Bitcoin price prediction: BTC declined amid Silvergate Bank and Tether news
On Wednesday, crypto-friendly bank Silvergate (SI) revealed it was a little deeper in trouble with a SEC filing that it would delay its financial report. The crypto bank then announced a halt to its payments network the Silvergate Exchange Network (SEN), triggering further uncertainty around its operations following the previously revealed $1 billion loss.
Indeed, selling pressure for BTC increased as major crypto firms including Coinbase and Paxos announced a switch from Silvergate to alternative banking partners.
But the price of bitcoin went on to touch lows of $22,000 as more negative news emerged – the Wall Street Journal published an article related to Tether, the company that issues the world’s largest stablecoin USDT. Allegedly, Tether and Bitfinex used “falsified documents” to acquire banks accounts amid questions over the stablecoin’s reserves.
Crypto trader and investor Scott Melker heighted the WSJ’s report in a Twitter thread on Friday.
The allegations in the report could have significant implications for Tether and the wider crypto market. If Tether's dollar reserves are not what they have been claimed to be, it could lead to a collapse in the value of the cryptocurrency.
— The Wolf Of All Streets (@scottmelker) March 3, 2023
Bitcoin price outlook: What next for BTC/USD?
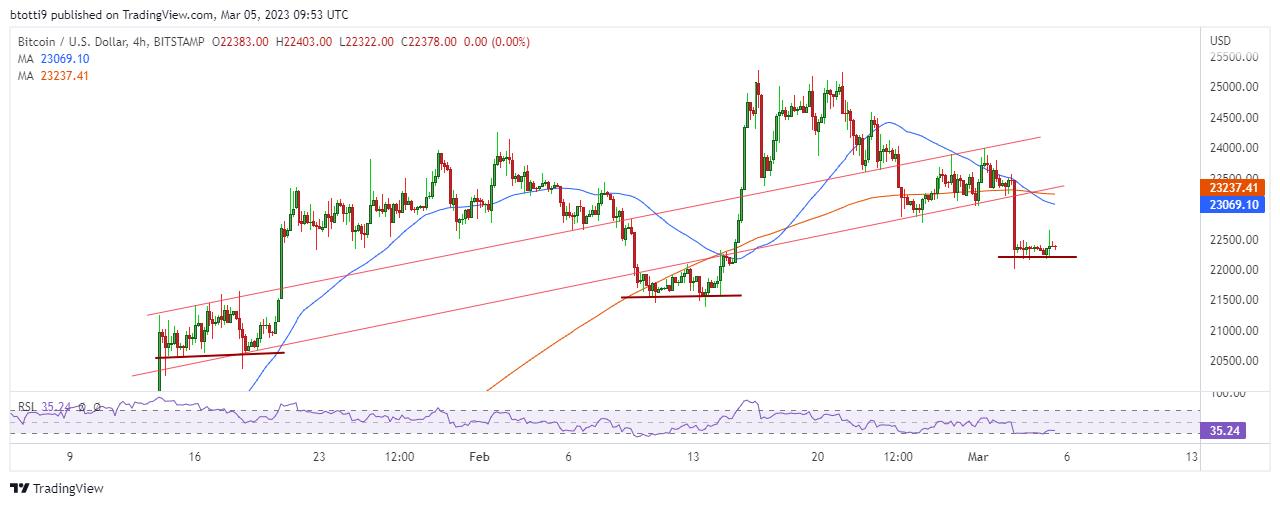
The RSI on the 4-hour chart remains largely flattened near the lower band as price action consists mainly of doji prints. While Bitcoin is holding above a support base formed in early January, there’s indecision as signaled by the doji candlesticks.

Bitcoin price movement on the 4-hour chart. Source: TradingView
If bears take charge further, BTC/USD will likely retest the aforementioned support line and potentially break past $22k to another key level near $21,600. Below that we could see a retest of the vastly important $20k level.
On the upside, the immediate hurdle is the $22.5k zone, with robust supply areas expected at the price levels currently signaled by the 50 and 200 moving averages.
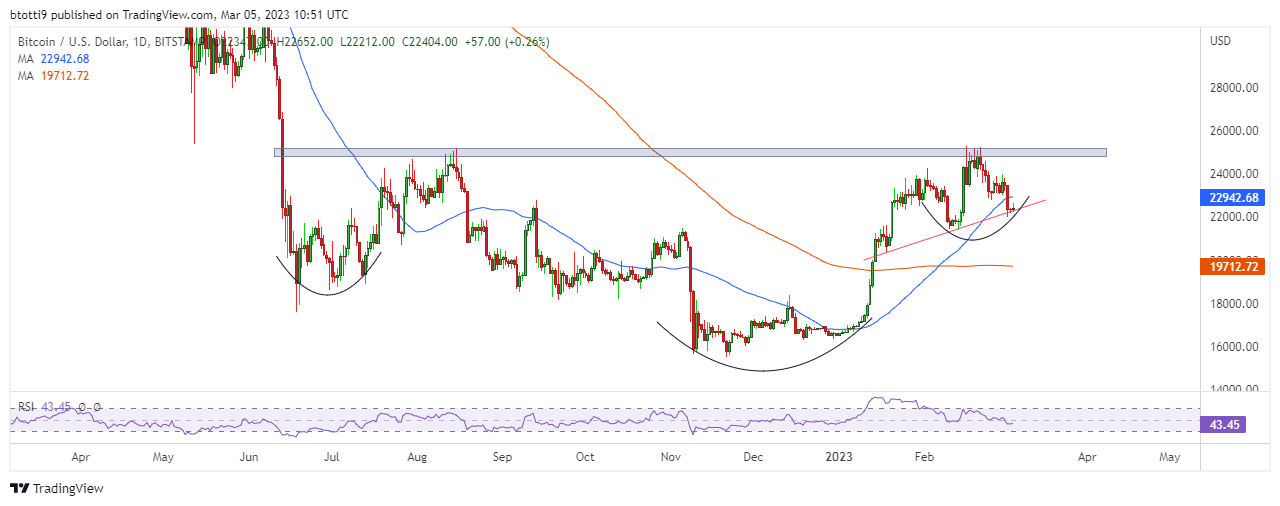
The outlook on the daily chart shows the RSI sloping to suggest bears might have an upper hand.
However, there’s potential formation of an inverse head & shoulders pattern. The neckline of this likely inverse H&S pattern could be in the $25k zone. In any case, the immediate key price levels to watch as signaled by the 50-day and 200-day moving averages near $22,900 on the upside and $19,712 on the downside.
 Bitcoin price prediction levels on daily chart.Source: TradingView

