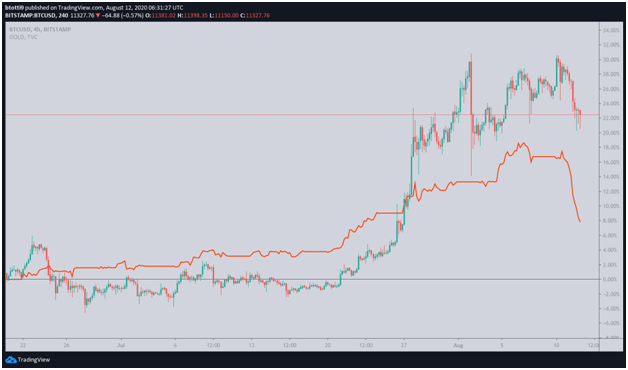
BTC price is down 4% over the past 24 hours as Gold slips from a high of $2,029 to lows of $1,901
Bitcoin dumped overnight, slipping by 4.4% to come close to $11,000 after bears pushed it to lows of $11,150. Heavy selling driven by profit-taking among traders is the likely reason for the dip. Gold has also dropped by more than 5% on the day, touching lows of $1,901.

The benchmark cryptocurrency was trading around $11,326 as of 04:50 UTC on August 12, while Gold had recovered from lows of $1,901 to trade around $1,917.
Notably, Gold’s drop was its biggest dump in a single day in over seven years, last seeing such a decline in 2013.
Bitcoin/Gold correlation highest
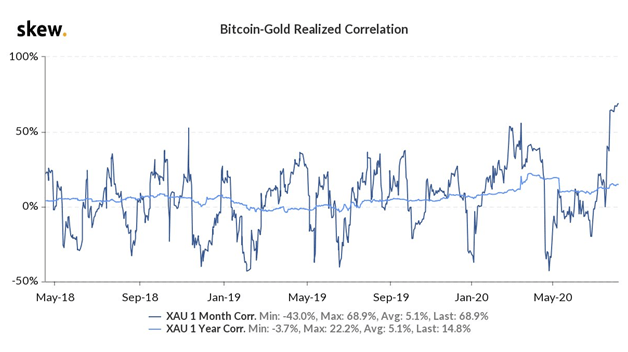
According to Skew Analytics, Bitcoin and Gold’s monthly correlation rate is now around 70%, a record high that surpasses the peaks observed in 2018 and May 2019.
The spike in correlation between the two assets once again adds momentum for Bitcoin’s reputation as a ‘digital gold’ or as a ‘store of value” as the precious metal, the analytics firm added.

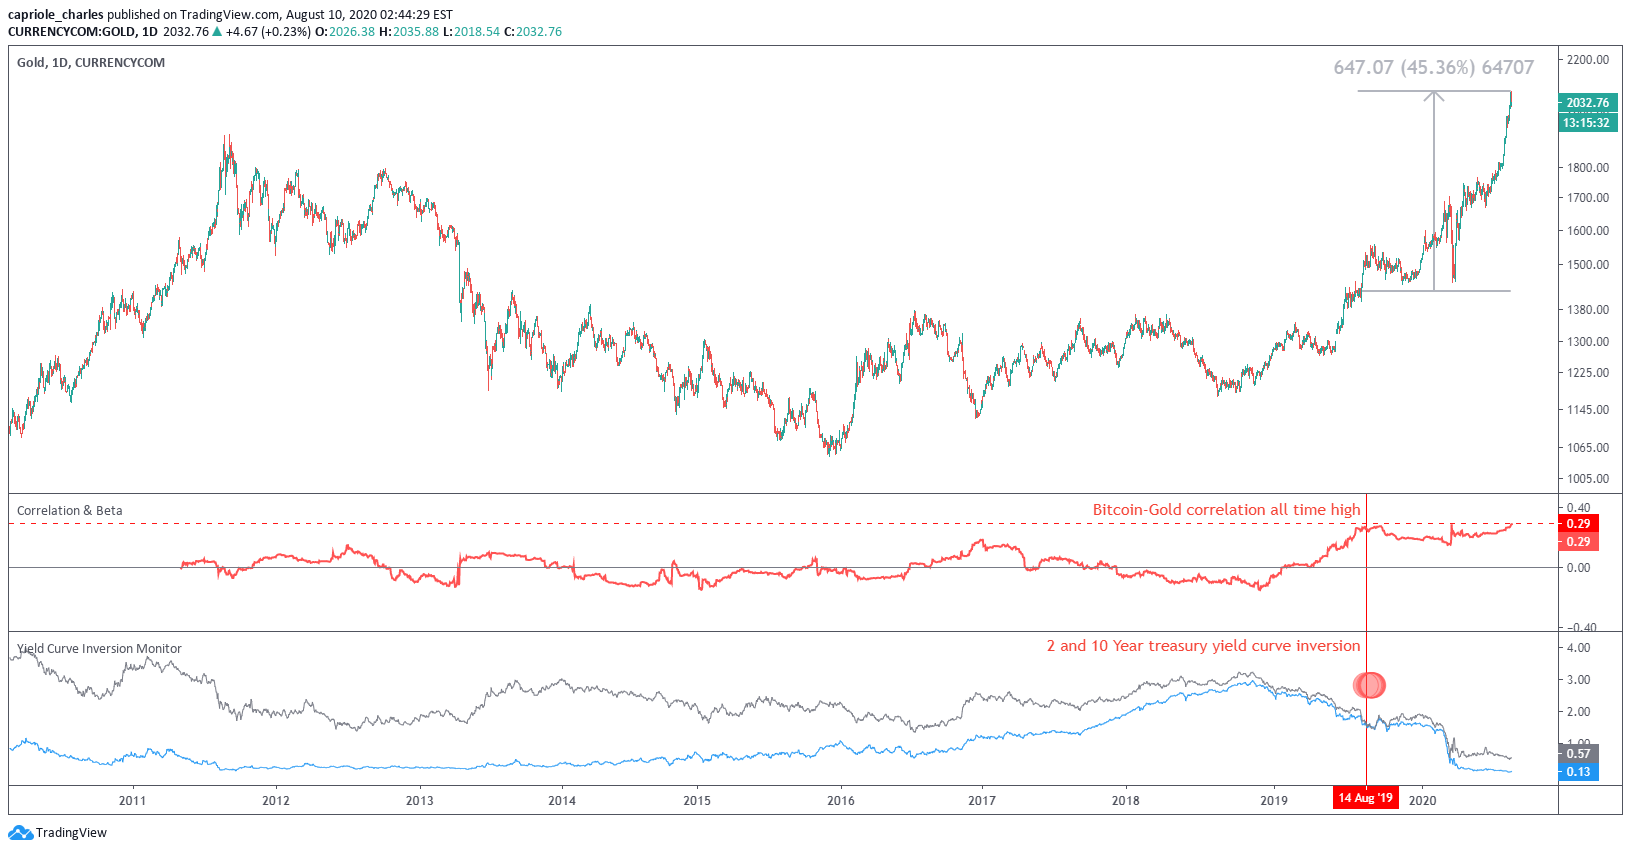
According to Capriole Fund’s Charles Edward, the correlation is “proof that Bitcoin is digital gold.” He shared the chart below via Twitter, noting that whenever the market risk has been at its highest, at least since 2019, Bitcoin and gold’s correlation has hit new highs.
The latest correlation rate is almost double the last ratio, which means prices for both the cryptocurrency and the precious metal “move together” more than “50% of the time”.

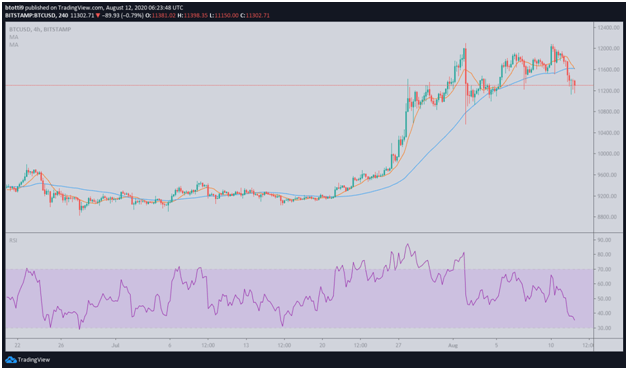
As of writing, the BTC/USD pair is printing bearish signals on the four-hour chart. Price is below both the 10 SMA and 50 SMA, while a southbound RSI indicates sellers still have an upper hand after sending prices lower during the Asian trading session.
The indicator could also be suggesting exhaustion on the part of bulls, a scenario that could see a pullback materialise over the next few days.


