More than 110,000 Bitcoin SV wallets bought the token at $181 to suggest bulls will defend the area and possibly push for $200
Bitcoin SV traded as high as $208 on September 1, before a broader crash within the crypto market saw it nosedive to lows of $150 by September 4. The decline meant the Bitcoin fork saw its native token break below multiple support levels as cryptocurrencies struggled to hold August gains.
Overall, Bitcoin SV dumped nearly 28% in three days to wipe half of the gains made between mid-July and early August.
As of writing, the BSV/USD price is down nearly 5% over the past 24 hours and 14% over the past seven days. The action aligns with most of the top cryptocurrencies, including BTC/USD and ETH/USD, which are 14% and 28% respectively in the red.
While BSV/USD is facing resistance around $174 on the 1-hour chart, there’s a likelihood of a major bounce short term.
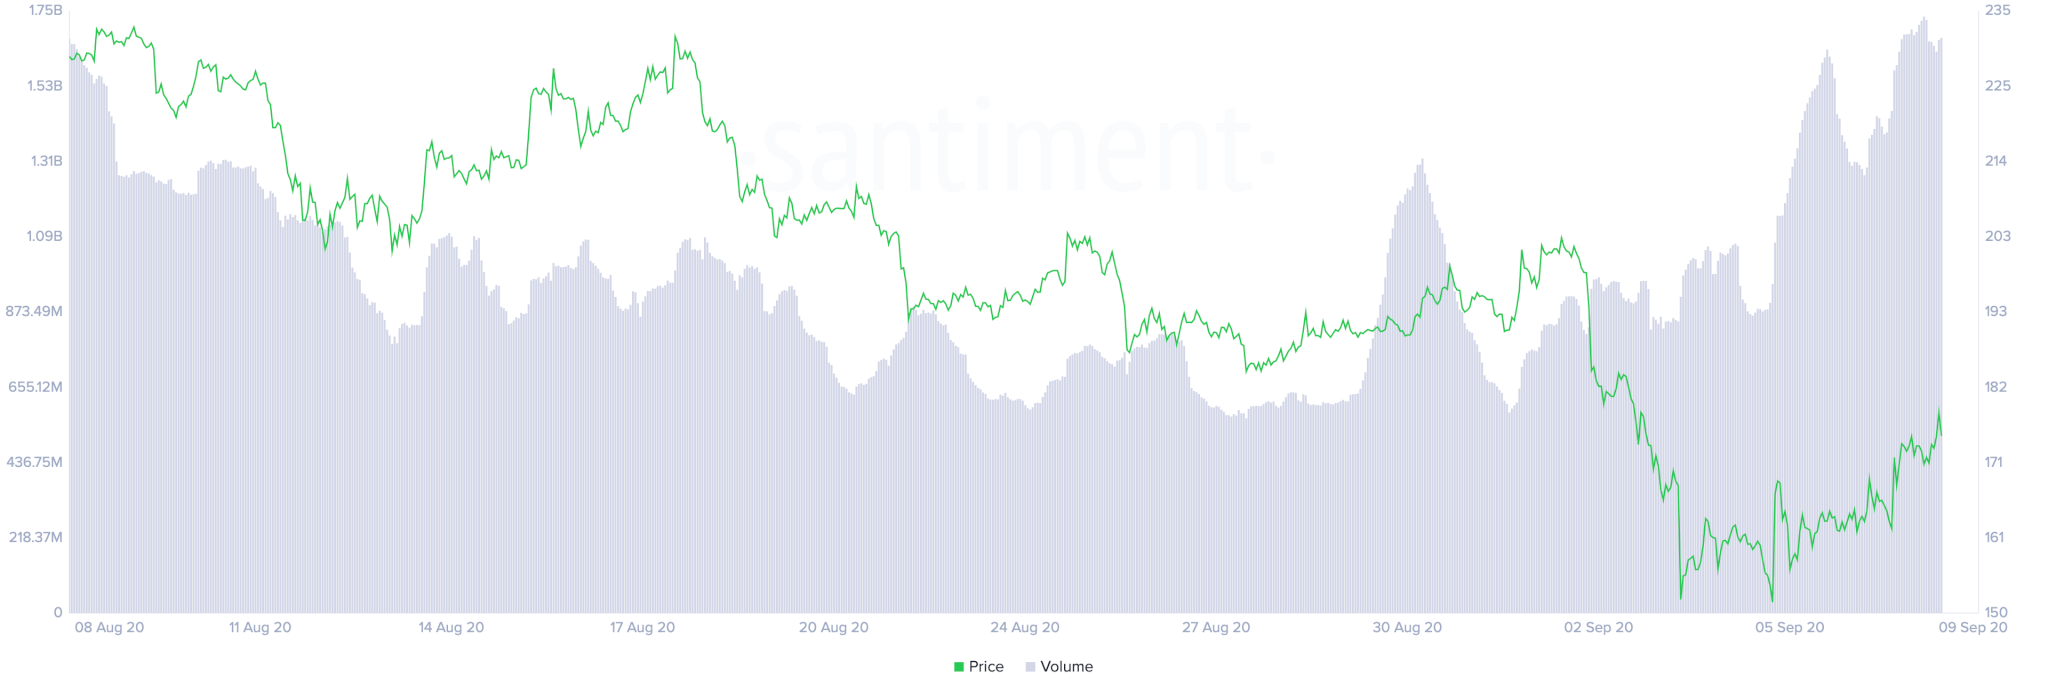
According to Ali Martinez aka ‘satoshilatino‘, there’s a bullish divergence forming given on-chain volume spiked from $920 million to $1.7 billion even as price declined.

Also boosting the price of the 9th ranked $165 million cap cryptocurrency is the latest listing on the Hotbit Korea crypto exchange.
BSV/USD technical analysis
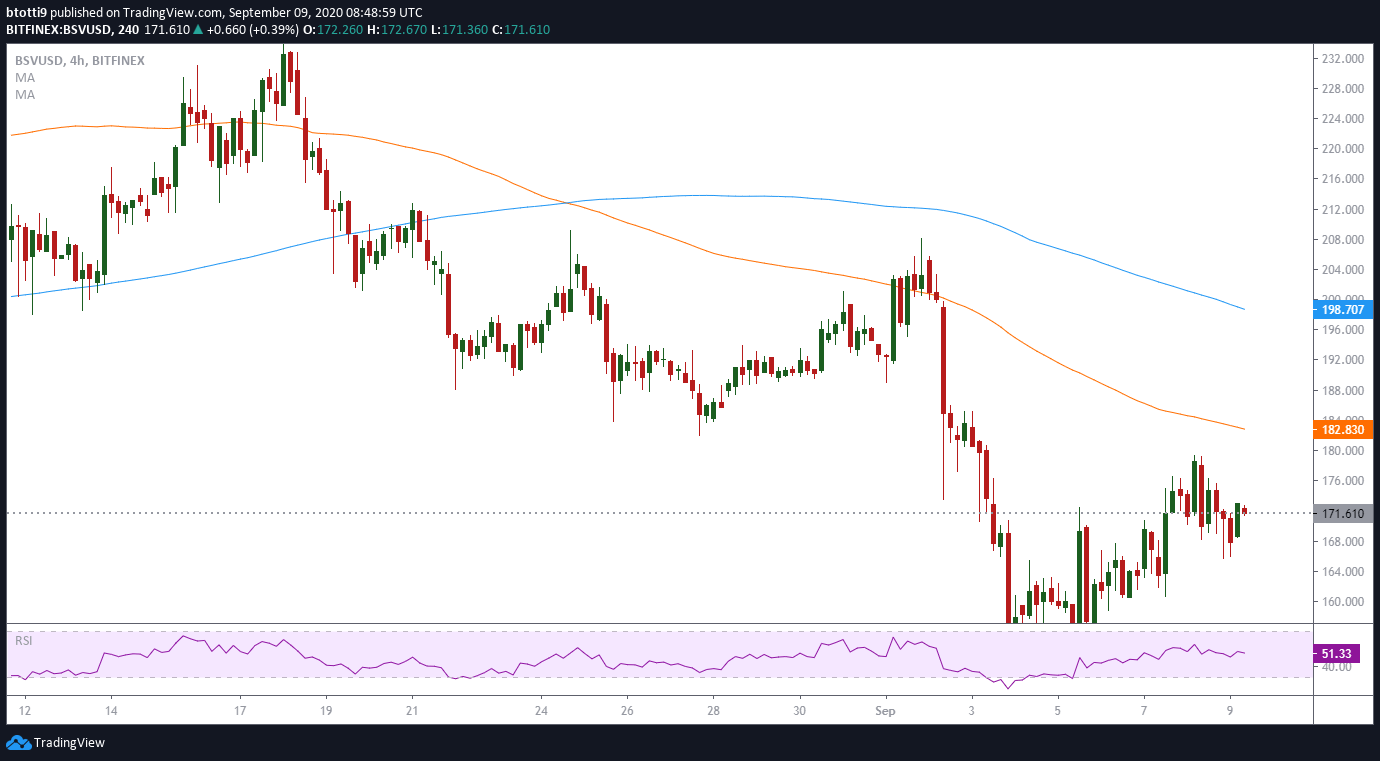
Bitcoin SV price is holding support at $170 to suggest that bulls are unlikely to give in so easily. However, they need to push above $175 to increase their chances of testing resistance zones at key price levels.

Data from IntoTheBlock suggests bulls face an important hurdle at $179-$184 where investors hold 221k coins purchased at around $181.68. The next major resistance will be around the $185-$190 area where 110k wallets purchased more than 750,000 BSV coins at an average price of $188.
The above on-chain statistic could be pivotal for the BSV/USD pair. As all these addresses are currently part of the 2.22 million in the red, the majority are unlikely to sell short term.
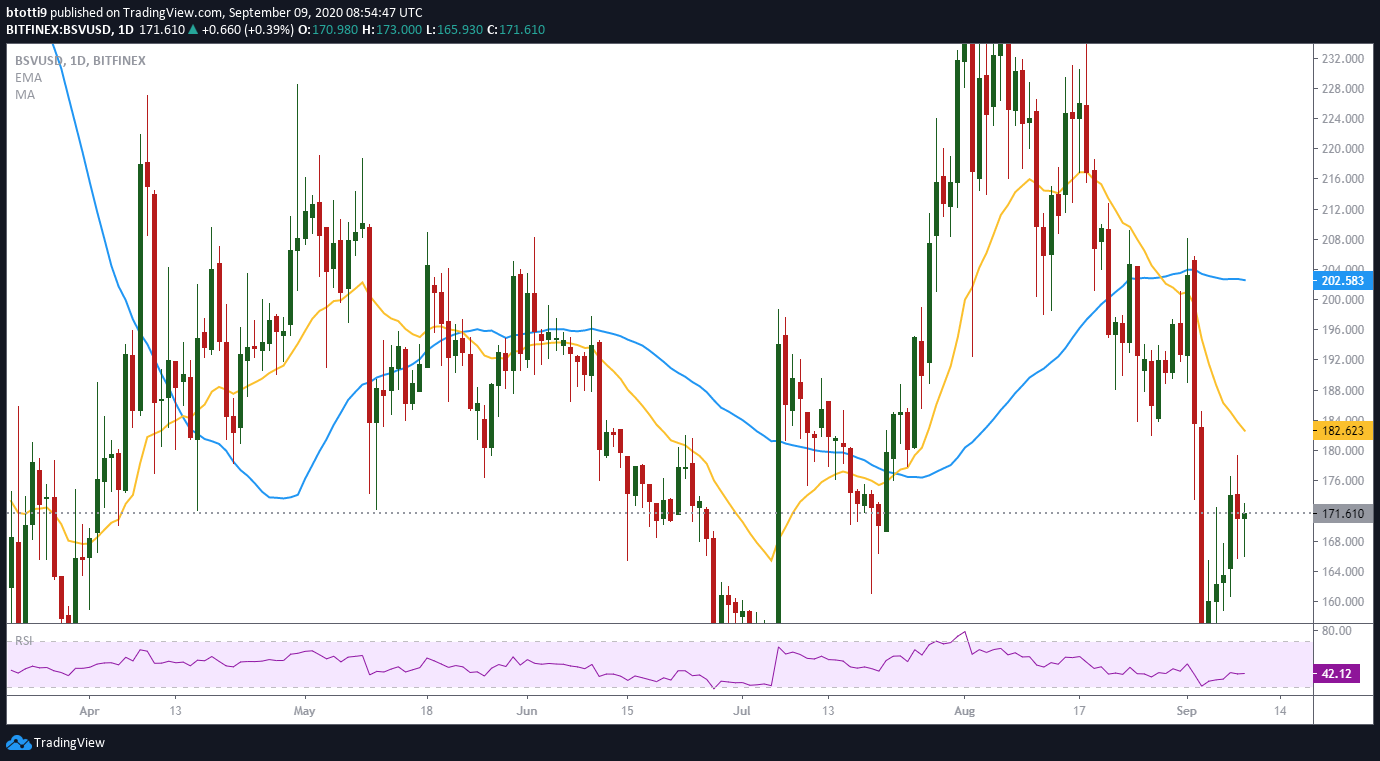
Although this indicates upside potential, bulls nonetheless need to clear resistance at the 50% Fibonacci level, 100 SMA, and 20-day EMA at $182.83 and $182.62 respectively.

Should the pair sustain the upside momentum, the area to watch will be the SMA 200 at $198.07 and the SMA 50 at $202.58. A break above this zone will see bulls push for the $230 resistance zone.

